
Figure 10.
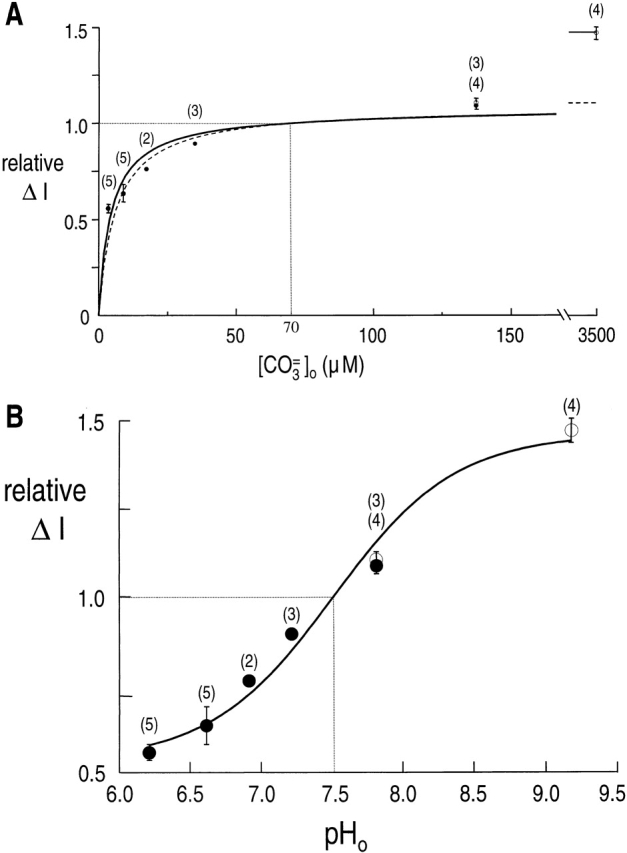
Effect of varying [CO3 =]o and pHo on the rkNBC current. (A) Relative rkNBC current as a function of [CO3 =]o. • represent data obtained in the presence of Ca2+, and ○, with Mg2+ replacing Ca2+. The dashed curve is the result of a nonlinear least-squares fit of the data by a normalized Michaelis-Menten equation. The best-fit value for K m(CO3 =) was 6.1 ± 1.5 μΜ, and for Imax, 1.09. The solid curve represents the best fit of the data by a normalized Michaelis-Menten equation plus a linear component. The best-fit value for K m(CO3 =) was 4.5 ± 0.6 μΜ, for Imax was 1.05, and for α was 0.000122 μΜ−1. (B) Relative rkNBC current as a function of pHo. The solid curve is the result of a nonlinear least-squares fit of the data by a normalized pH titration curve ( Boron and Knakal 1992). The best-fit value for pK was 7.50 ± 0.05. The number of determinations is given in parentheses. The vertical bars indicate SEM values; they are omitted where the length of the bar is smaller than the size of the symbol.