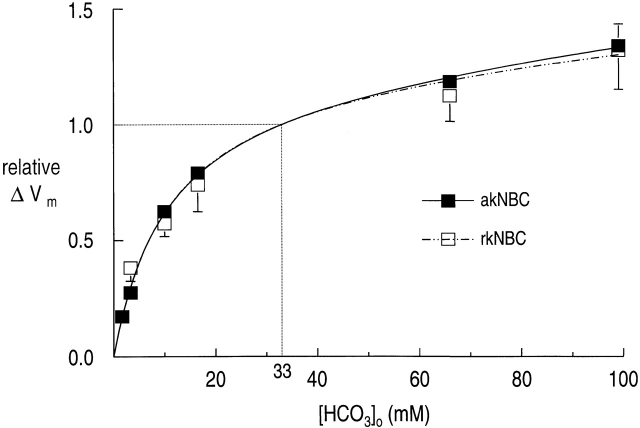
Figure 3.
[HCO3 −]o dependence of akNBC and rkNBC, based on ΔVm data. The solid curve represents the result of a nonlinear least-squares curve fit of to the akNBC data (▪) similar to those shown in Fig. 2 . The broken curve represents the result of a similar fit to the rkNBC data (□). Each symbol represents the mean of six to nine data points, obtained in separate experiments. The vertical bars represent SEMs; the bars are omitted when they are smaller than the size of the symbol. The kinetic parameters are summarized in the first two lines of Table .

