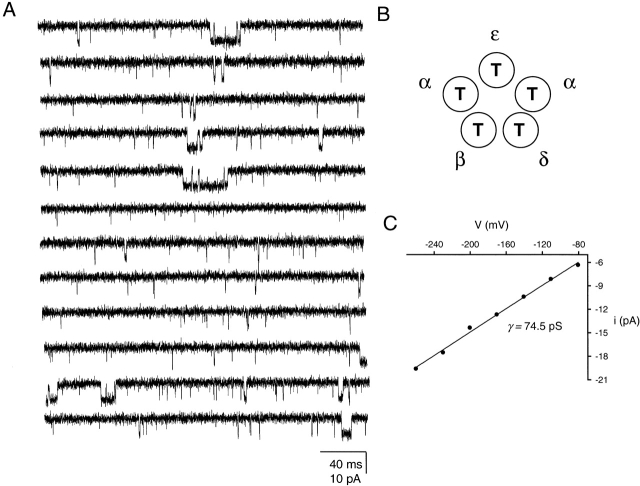
Figure 2.
δS→T AChR unliganded gating. (A) Continuous single-channel traces of spontaneous openings recorded at approximately −100 mV. Note the multiplicity of closed- and open- time components. Display fc ≅ 6 kHz. Openings are downwards. (B) Schematic representation of the residues occupying the M2 12′ position in δS→T receptors. (C) I-V curve under cell-attached conditions and least-square fit with a straight line.

