
Figure 4.
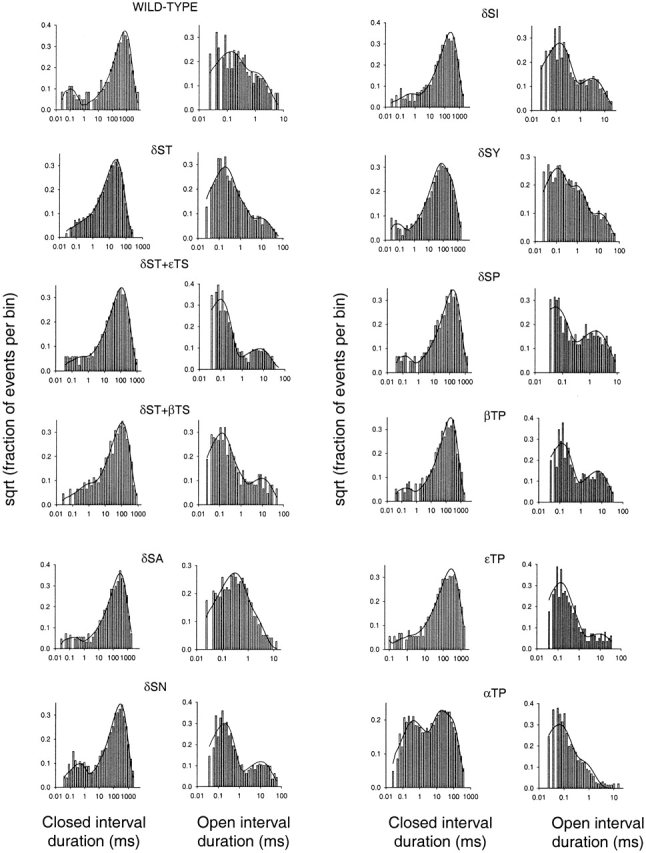
Dwell-time histograms and superimposed density functions corresponding to wild-type and M2 12′ mutant AChR unliganded gating. The kinetics of δS→T, δS→T + βT→S, and εT→P receptors were fitted to Fig. 3 A. Those of the wild-type and δS→T + εT→S, δS→A, δS→N, δS→I, δS→P, and βT→P receptors were fitted to Fig. 3 B. Those of δS→Y and αT→P receptors were fitted to Fig. 3 G. The corresponding rate constant estimates are listed in Table . Each histogram corresponds to data recorded in one example patch for each construct.