
Figure 4.
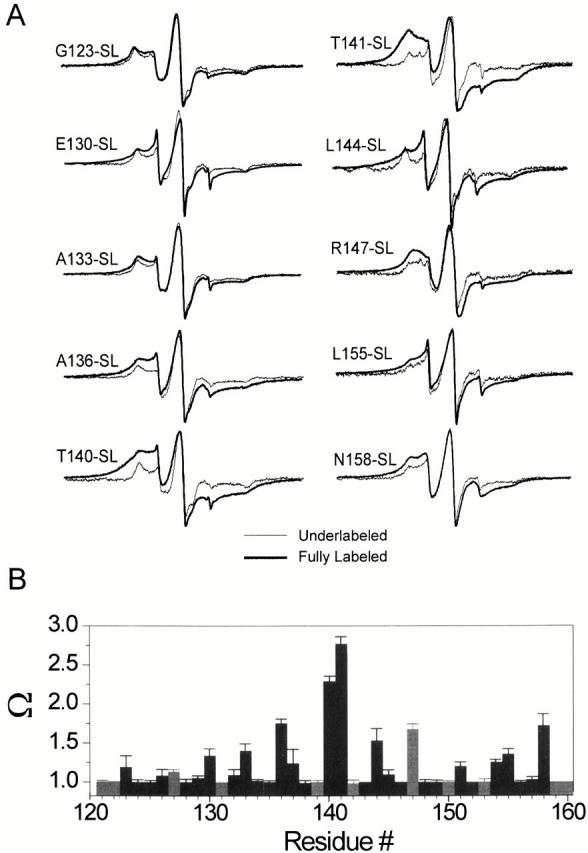
Intersubunit proximities and the distribution of spin–spin dipolar couplings at the COOH terminus of KcsA. (A) CW-EPR spectra of residues showing strong spin–spin interactions. A comparison is made between fully labeled channels (a maximum of four spin/channel), in red, and channels that show no spin–spin interaction by virtue of being underlabeled at a 1:10 label/channel molar ratio (so that on average they have 1 spin/channel), in black. (B) Spin–spin interaction parameter (Ω) calculated for the all residues of the COOH terminus. As the Ω parameter serves as a gross estimate of intersubunit proximity, this particular pattern of per-residue Ω has been taken to indicate the formation of a four-helix bundle. The gray bars represent charged residues.