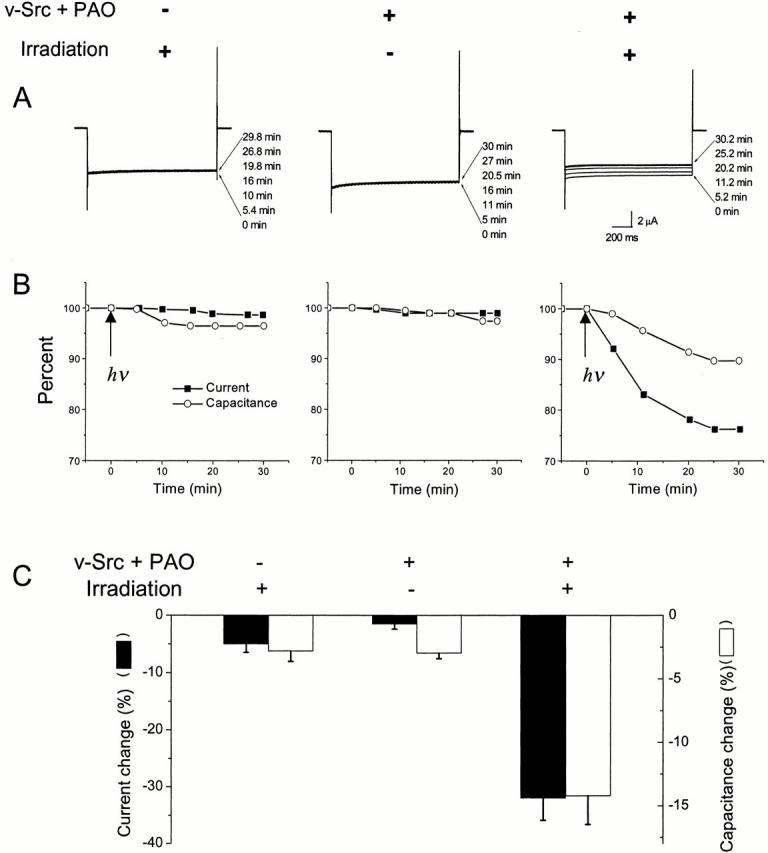
Figure 4.

Inhibition of current and decrease of capacitance in oocytes expressing Kir2.1-Y242TAG suppressed with Tyr(ONB). (A) Typical current traces from individual oocytes. The left panel shows the effect of irradiating an oocyte (3 s at arrow) that is neither coexpressing v-Src nor exposed to PAO. The center panel shows the effect of coexpression of v-Src and exposure to PAO, but no irradiation of the oocyte. The right panel shows traces from an oocyte coexpressing v-Src, exposed to PAO, and irradiated. Oocytes were clamped at 0 mV and stepped to −80 mV to elicit an inward current. Bath solutions contained 96 mM KCl. Time after irradiation is shown. (B) Plots of current and capacitance versus time from the individual oocytes in A. (C) Averaged data from batches of oocytes recorded at t = 30 min. The filled bars correspond to the left-hand y-axis, indicating normalized current decrease. Average values (and ranges) for 100% current were 8.7 (5.5–13), 6.5 (4.5–10.4), and 6.6 (1.6–15.5) μA for the three groups (left to right). The hollow bars correspond to the right-hand y-axis, indicating capacitance decrease. Average values (and ranges) for 100% capacitance were 190 (159–227), 187 (167–202), and 194 (132–234) nF for the three groups (left to right). Error bars indicate SEM, n = 4–6 oocytes.
