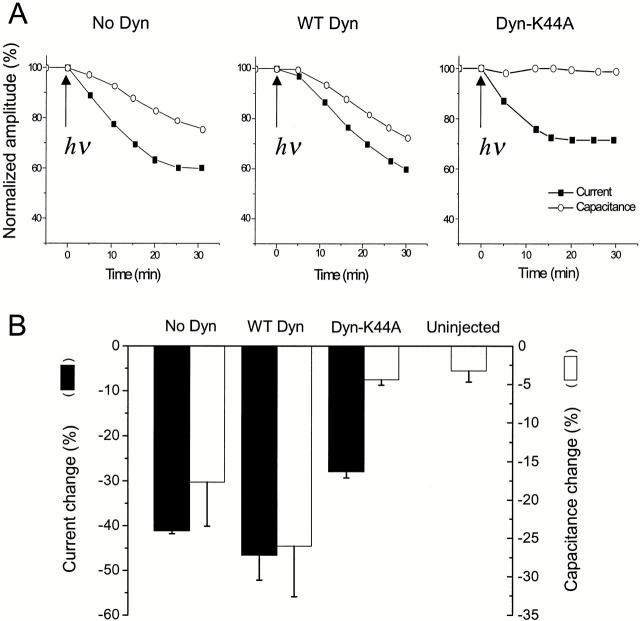
Figure 5.
Dynamin expression distinguishes inhibition of the channel from endocytosis. (A) Current and capacitance data from representative oocytes coexpressing v-Src and Kir2.1-Y242TAG suppressed with Tyr(ONB) and treated with PAO. Data were recorded 48 h after injection. (Left) An oocyte without coinjected dynamin cRNA. (Center) An oocyte coinjected with 10 ng WT dynamin cRNA. The capacitance decrease for this cell was unusually large. (Right) An oocyte coinjected with 10 ng dominant negative dynamin-K44A. (B) Data for current and capacitance for oocytes recorded 30 min after irradiation (mean ± SEM, n = 5). Left-hand y-axis and full bars represent normalized current decrease. Average values (and ranges) for 100% were 4.1 (3.15–4.8), 3.1 (2.8–3.7), and 4.1 (3.0–5.7) μA for the three groups (left to right). Right-hand axis corresponds to hollow bars, representing normalized capacitance decrease. The rightmost column shows capacitance change of uninjected control oocytes. Average values (and ranges) for 100% capacitance were 197 (191–205), 225 (191–248), 189 (174–199), and 197 (190–209) nF for the four groups (left to right). Error bars represent SEM.

