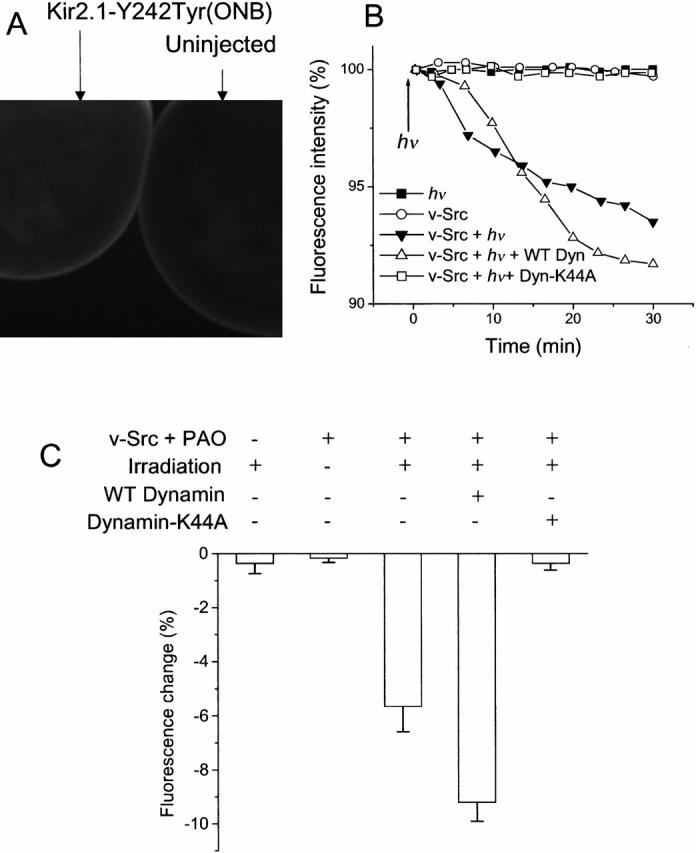
Figure 6.

Fluorescence analysis of membrane retrieval. (A) Confocal image of two oocytes labeled with 10 μM tetramethylrhodamine-5-maleimide, a membrane-impermeant thiol-reactive fluorophore. The oocyte at left was injected with v-Src and Kir2.1-Y242TAG suppressed with Tyr(ONB). The oocyte on the right was not injected. (B) Fluorescence measurements for individual oocytes coexpressing v-Src and Kir2.1 Y242Tyr(ONB) and exposed to PAO. Oocytes were labeled with 10 μM tetramethylrhodamine-5-maleimide for 30 min before recording. Fluorescence is measured as PMT output voltage. As indicated, controls included omission of coinjected v-Src and omission of irradiation. (C) Normalized, average fluorescence change at t = 30 min for oocytes expressing Kir2.1-Y242TAG suppressed with Tyr(ONB) and treated with PAO, and then labeled with tetramethylrhodamine maleimide. The first column represents a control in which oocytes were not coinjected with v-Src. In all other columns, oocytes expressed the Kir2.1-Y242Tyr(ONB) along with v-Src. The second column represents a control in which oocytes were not irradiated. In the third column, no exogenous dynamin was added. The fourth column shows oocytes coexpressing WT dynamin. The fifth column represents oocytes coexpressing dynamin-K44A. Each bar represents six or seven oocytes. The average values (and ranges) for 100% fluorescence were 5.76 (3–9.5), 5.74 (3.5–7.2), 6.45 (3.7–9.5), 5.60 (3.93–6.92), and 5.62 (1–9.7) V.
