
Figure 3.
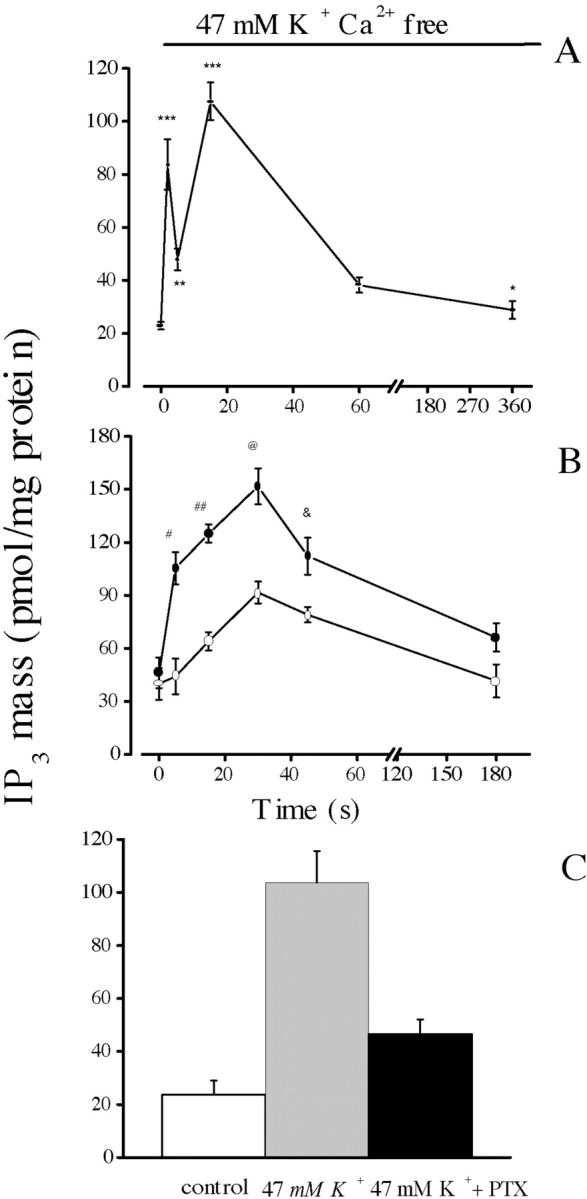
Effect of nifedipine on IP3 mass changes following K+ depolarization in primary muscle cultures. Confluent plates of myotubes were washed three times with PBS and incubated during the times indicated with 47 mM K+, both in the presence (B and C) and in the absence (A) of extracellular calcium. The mass of IP3 in the extract was measured by radioreceptor assay. (A) Time course for the increase in the mass of IP3 in the absence of external calcium. The biphasic nature (an early fast and a later slower component) of the increase is clearer here than in B because measurements were made at shorter time intervals (2.0 s) during the onset of the transient. Values were expressed as the mean ± SD of at least three different samples from the same experiment. Paired t-tests were performed (**, P < 0.0006 [n = 4]; ***, P < 0.0004 [n = 4]) comparing each point with value at t = 0. (B) Samples incubated in the absence (filled circles) or in the presence (open circles) of 10 μM nifedipine. Note the slow kinetics of the transient increase in IP3 mass in the presence of nifedipine. Values were expressed as the mean ± SD of at least three different samples from a single experiment done in duplicate, for control and in the presence of nifedipine. Thus, these two curves can be directly compared. Paired t tests, comparing each point were performed (#, P < 0.0002 [n = 4] at t = 5 s; ##, P < 0.0001 [n = 4] at t = 15 s; @, P < 0.0005 [n = 3] at t = 30 s; &, P < 0.0047 [n = 3] at t = 45 s). (C) Mean values for control and depolarized cells after 15 s of high potassium exposure both in the absence and in the presence of 10 μM pertussis toxin. Error bars represent SD.