Figure 5.
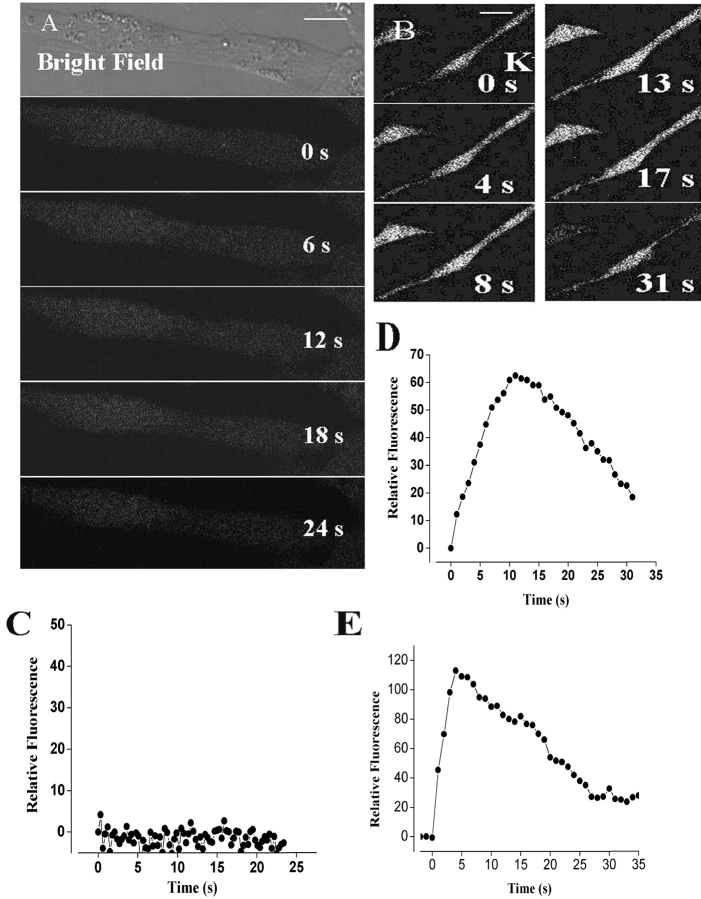
Depolarization-evoked calcium signals in GLT and GLT-α1 subunit–transfected cell lines. (A) Series of fluo-3 fluorescence images during the depolarization with a high potassium solution (47 mM) at the times indicated in nontransfected GLT dysgenic cells. These cells showed no fast or slow calcium signals (Bar = 10 μm). (B) Series of fluo-3 fluorescence images during a depolarization with a high potassium solution at the times indicated in GLT dysgenic cell lines transfected with the plasmid containing the α1 subunit of the DHPR. In contrast to what we observed in GLT myotubes and in the mock-transfected cells (GLT-NEO), we observed a slow depolarization-evoked calcium signal. Note that the slow transient (documented in D) lasts even longer than the one from primary cultures shown in Figs. 1 C and 2 A). Bar = 20 μm. (C) Relative fluorescence variation in an ROI during potassium depolarization at the time indicated in GLT cells. (D) Relative florescence in an ROI in GLT cells transfected with the α1 subunit. (E) Relative fluorescence variation in an ROI during potassium depolarization at the times indicated in control NLT cells.

