
Figure 6.
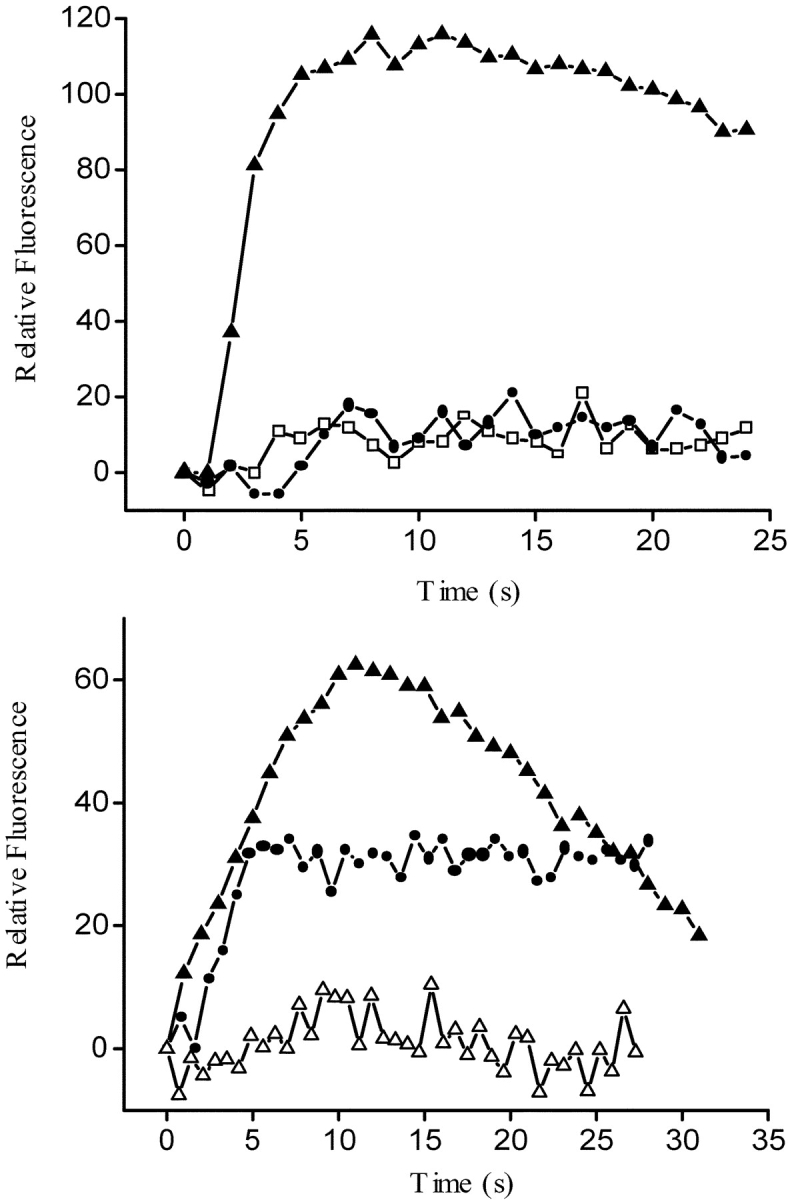
Fluo-3 relative fluorescence variation in an ROI from GLT cells: GLT-NEO, GLT-α1, and GLT-α1 in the presence of nifedipine and ryanodine. (A) Relative fluorescence variation in an ROI during the depolarization-evoked stimulus (47mM K+) in previously fluo-3 a.m.–loaded GLT cells. Mock-transfected GLT (open squares); GLT-α1–transfected (filled triangles), and GLT-α1–transfected cells plus nifedipine (filled circles). (B) Relative fluorescence variation in an ROI during the depolarization evoked stimulus (47 mM K+) in previously fluo-3 a.m.–loaded GLT cells: GLT-α1–transfected, (filled triangles), GLT-α1–transfected cells plus ryanodine (10 μM) (filled circles), and GLT-α1–transfected cells plus nifedipine and ryanodine (open triangles). All these experiments were carried in the presence of 0.5 mM EGTA to reduce any Ca2+ entry from the medium.