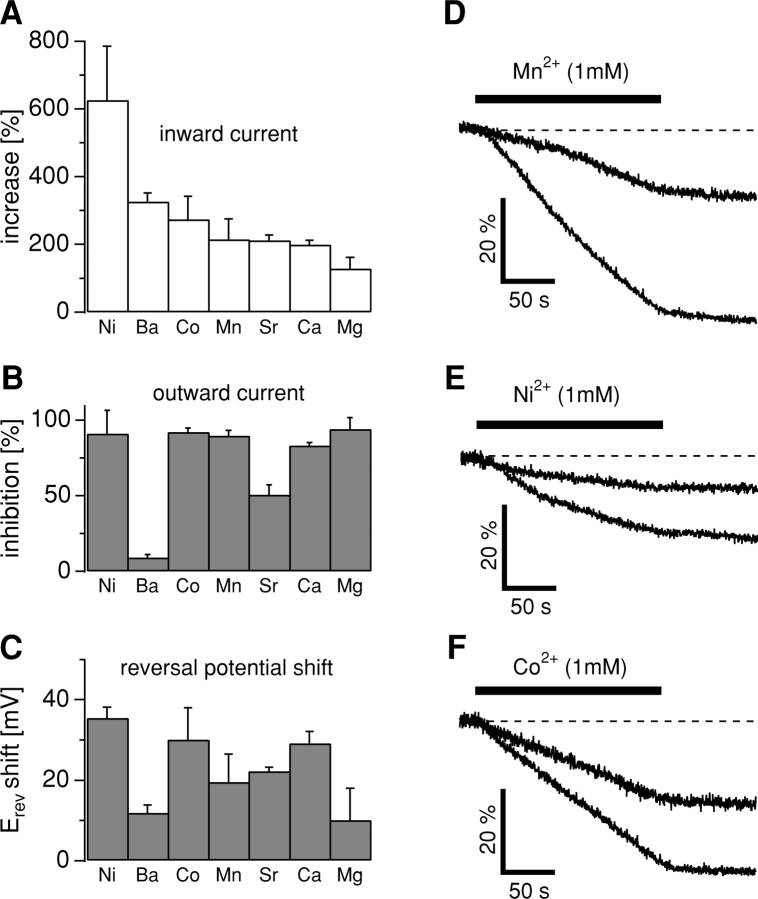
Figure 4.
(A) The rank order of permeation through TRPM7 based on percentage increase (±SEM) of the peak inward current. Note that increases are relative to 1 mM Ca2+. (B) Corresponding effects on the outward current as percent inhibition (±SEM). (C) Relative shift of reversal potential (Erev) to control Erev (see below) induced by application of the respective isotonic divalent solutions. Data are sorted according to the rank order of inward current (A). The average control reversal potential before application was −7.5 mV ± 5 mV (n = 31) as indicated in Fig. 3 E. (D) Mn2+-induced quench of fura-2 fluorescence at 360 nm excitation in HEK-293 cells induced to overexpress TRPM7 (n = 3) and transfected cells that remained uninduced (n = 3). Cells were kept in an extracellular solution supplemented with 3 mM Ca2+ and 0 Mg2+. The application contained 1 mM Mn2+, 1 mM Ca2+, and 1 mM Mg2+ as divalent ions. (E) Ni2+-induced quench of fura-2 fluorescence at 360 nm excitation in HEK-293 cells induced to overexpress TRPM7 (n = 4) and control cells that remained uninduced (n = 3). Cells were kept in an extracellular solution as described in Fig. 4 D. The application contained standard solution with 1 mM Ni2+, 1 mM Ca2+, and 1 mM Mg2+ as divalent ions. (F) Co2+-induced quench of fura-2 fluorescence at 360 nm excitation in HEK-293 overexpressing TRPM7 (n = 3) and in uninduced control cells (n = 3). Cells were kept in an extracellular solution as described in Fig. 4 D. The application contained standard solution with 1 mM Co2+, 1 mM Ca2+, and 1 mM Mg2+ as divalent ions.

