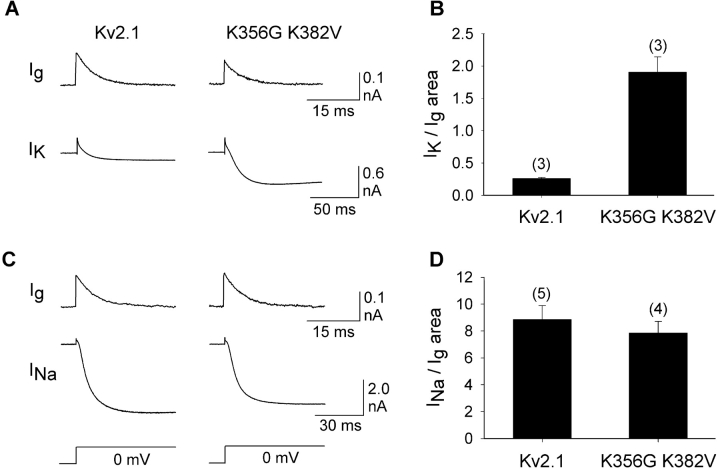
Figure 4.
Effect of outer vestibule mutations on K+ and Na+ conductances. (A and C) Currents are shown from wild-type Kv2.1 (left column) and Kv2.1 K382V K356G (right column). The currents in the top row (Ig) illustrate on-gating currents obtained with 125 mM internal and 155 mM external NMG+ (no K+ or Na+). After recording the gating currents, the external solution was changed to one containing 1 mM K+ plus 155 mM NMG+ (A) or 125 mM Na+ plus 30 mM NMG+ (C). Below the gating currents, inward K+ currents (IK in A) and Na+ currents (INa, in C) for each of the two channels are shown. (B) The size of the K+ current, normalized to area under the gating current, for both channel types. (D) The size of the Na+ current, normalized to the area under the gating current, for both channel types. Numbers in parentheses denote the number of cells examined. The mean area under the gating current was statistically identical for each channel type (Kv2.1: 336 ± 105 C [n = 8]; Kv2.1 K356G K382V: 389 ± 75 C [n = 7]).

