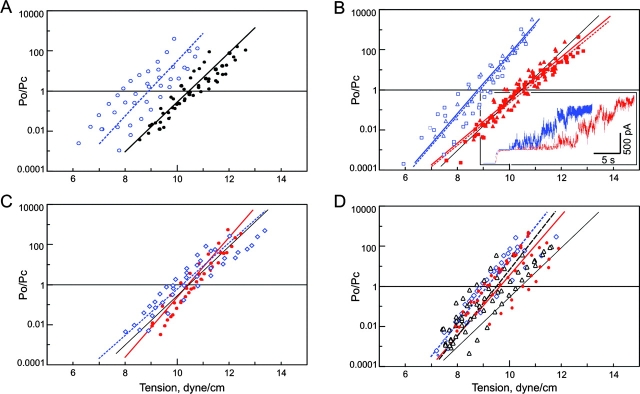
Figure 6.
Dose–response curves for WT MscL, S3 mutants with substituted leucines, and the Δ110–136 truncation mutant. The data is presented as Po/Pc values versus membrane tension. Four to seven curves measured on independent patches were plotted and fitted according to the two-state model (see materials and methods). The lines represent curves with average parameters ΔE and ΔA (see Table III) for each dataset. (A) WT MscL measured under ambient conditions (filled circles, black solid line) or in the presence of 25 mM DTT (blue open circles, dotted line). (B) L121C/L122C (squares, solid line) and L128C/L129C (triangles, dotted line) measured under ambient (red) or reducing (blue) conditions. (set) Single-channel traces of L128C/L129C MscL measured under ambient conditions (red) or in the presence of 25 mM DTT (blue) in the same patch, in response to a similar sequence of pressure steps. (C) L121A/L122A (red) and L121T/L122T (blue) measured under ambient conditions. (D) The data for the quadruple L121A/L122A/L128A/L129A (red circles and solid line) and L121T/L122T/L128T/L129T (blue diamonds and dotted line) mutants and for the truncated Δ110–136 MscL mutant (triangles, black dashed line). The black solid line representing WT MscL is given as reference in each panel.

