
Figure 7.
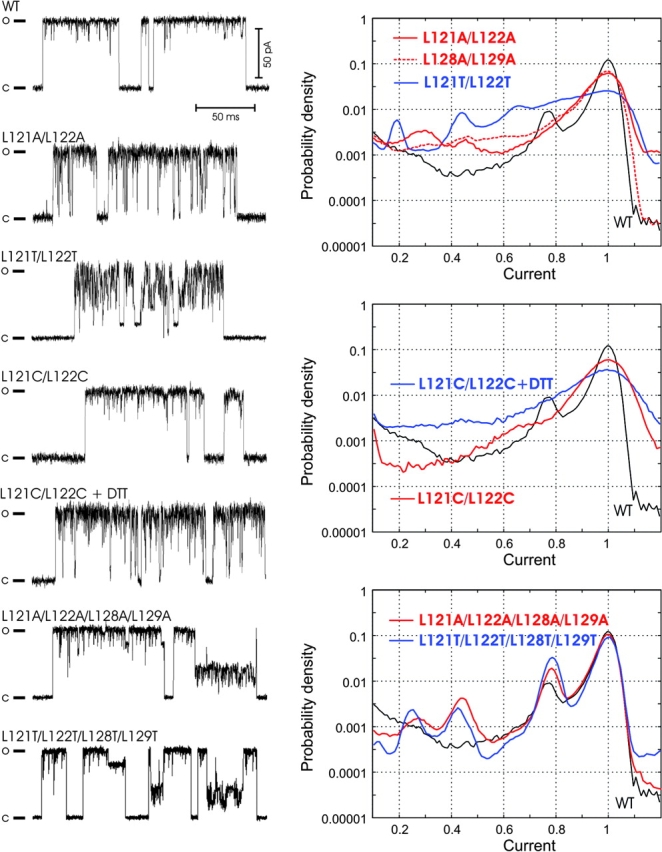
Representative single-channel traces (left) and probability density amplitude histograms (right) for WT MscL and mutants with alanines, threonines, or cysteines substituting for conserved leucines in S3. Cysteine mutants were characterized under ambient or reducing conditions. The histograms for WT are shown in all panels as reference (black solid line).