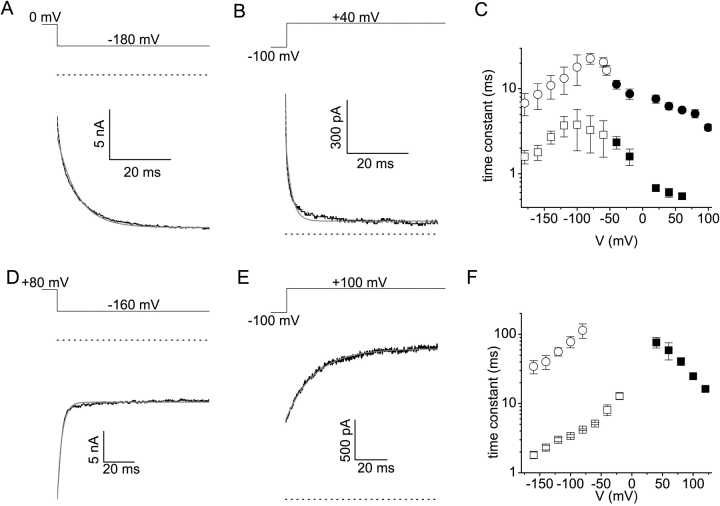
Figure 8.
Analysis of the kinetics of Mg2+ block and unblock. (A and B) Current traces obtained with a divalent-free extracellular solution and with 1 mM free intracellular Mg2+ in response to the indicated voltage step. Single (solid gray) and double (dotted gray) exponential fits are superimposed. (C) Fast (squares) and slow (circles) time constants obtained from double exponential fits as in A and B. The open symbols were obtained from the fits to currents in response to a hyperpolarizing step from a holding potential of 0 mV, as in A. The filled symbols were obtained from the fits to currents in response to a depolarizing step from a holding potential of −100 mV, as in B. (D and E) Current traces obtained with a divalent–free intracellular solution and with 500 μM free extracellular Mg2+ in response to the indicated voltage step. Single (solid gray) and double (dotted gray) exponential fits are superimposed. (F) Fast (squares) and slow (circles) time constants obtained from single or double exponential fits as in (D and E). The open symbols were obtained from the fits to currents in response to a hyperpolarizing step from a holding potential of 80 mV, as in D. The filled symbols were obtained from the fits to currents in response to a depolarizing step from a holding potential of −100 mV, as in E.

