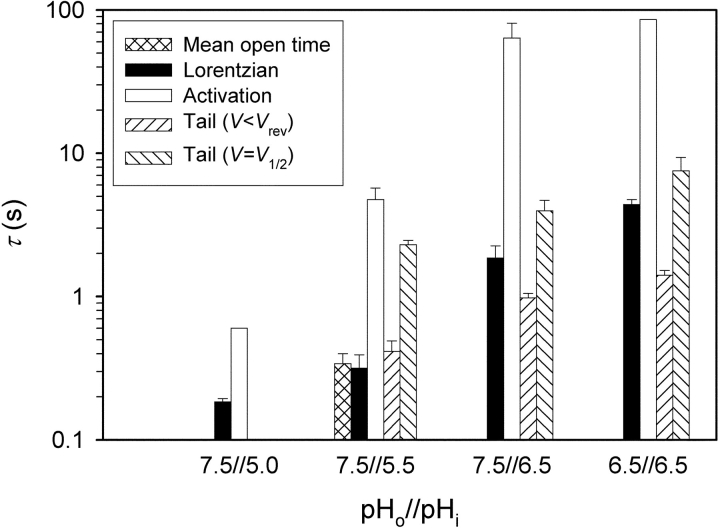
Figure 13.
Comparison of the Lorentzian time constants (τ L), single-channel mean open times, and time constants of H+ current activation (τ act) and deactivation (τ tail) at various pHo and pHi. Mean open time is the global mean of data at −60 mV from five patches (n = 9–33 in each patch), estimated from current records like those in Fig. 9, in which apparently discrete single-channel events occurred near V threshold, all filtered at 10–20 Hz. τ act was determined by fitting the function I = I max [1 − exp(−t/τ act)] to I(t) curves such as those in Fig. 2 (top two panels). Mean values of τ act for P open = 0.5P max are compared with mean values of τ L (which showed no consistent dependence on P open). Bars show standard errors from 2–4 patches; no error bars indicate only one patch was available. τ tail at V < V rev was determined by fitting a single exponential to tail currents recorded ∼10 mV negative to V rev (mean ± SE, n = 8–18 for each pH). Also shown are τ tail values extrapolated to the midpoint voltage of the g H-V relationship, assuming exponential voltage dependence with a slope of 40 mV/e-fold change in τ tail.

