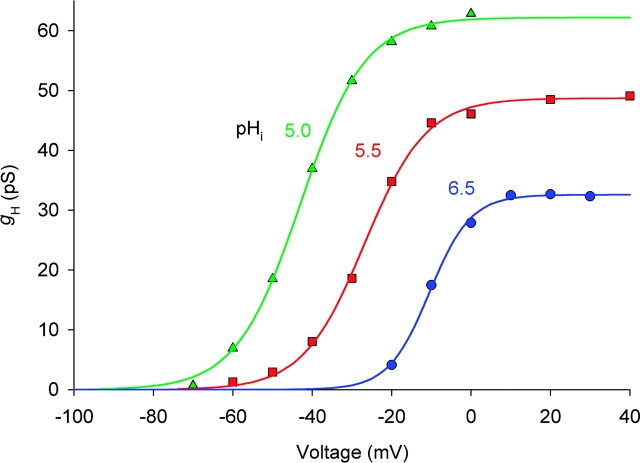
Figure 3.
Steady-state g H-V relationships for the patch illustrated in Fig. 2. Chord conductance, g H, was calculated assuming V rev of −40, −80, and −100 mV, at pHi 6.5 (•), 5.5 (▪), and 5.0 (▴), respectively. Curves show best-fitting (by nonlinear least squares) Boltzmann functions: g H = g H,max {1 + exp[−(V − V 1/2)/k]}−1 with midpoints (V 1/2) of −10.4, −26.9, and −43.0 mV, slope factors (k) of 5.2, 7.8, and 8.1 mV, and g H,max of 32.6, 48.7, and 62.2 pS at pHi 6.5, 5.5, and 5.0, respectively. ES-2596.

