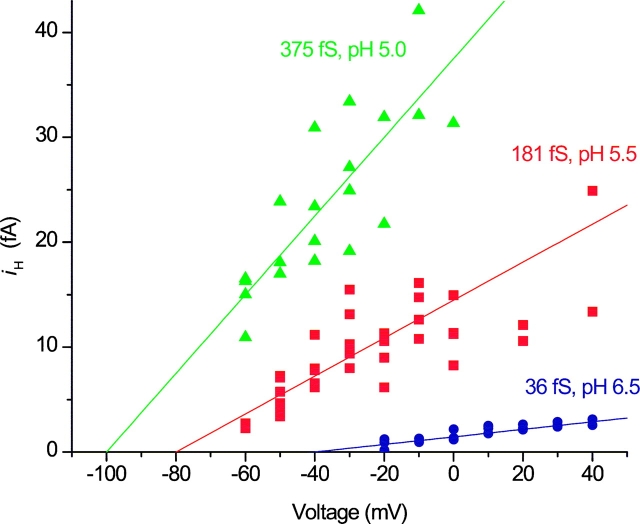
Figure 8.
Single H+ channel current-voltage plots in the same patch and with the same symbol meanings as in Figs. 2–4 and 6 and 7. Estimates for i H were obtained by using Eq. 1, where P open is derived from the analysis in Fig. 7, and ultimately from the estimates of γH and N obtained from the y-gH plot (Fig. 6). ES-2596.

