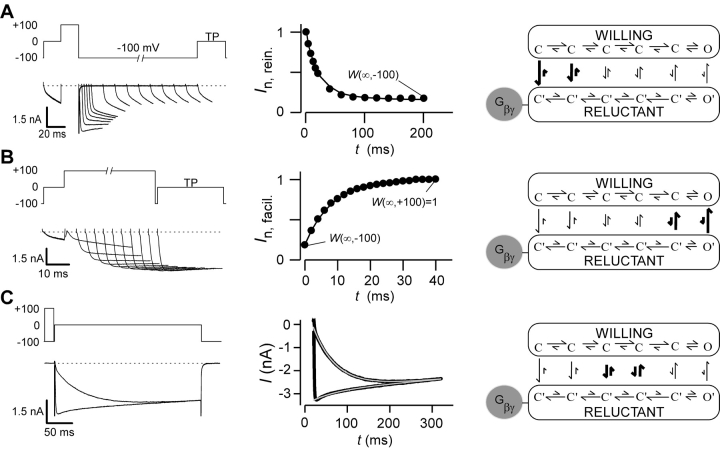
Figure 1.
Gβγ modulation of N-type calcium channels. (A, left) Variable duration reinhibition protocol elicited by facilitating all channels with a depolarizing prepulse to 100 mV, followed by repolarization to −100 mV for variable durations, and then measuring the test-pulse current (TP) at 0 mV (5 ms into the trace). Tail and outward currents were clipped here and throughout this figure for clarity. (A, middle) Normalized test-pulse currents plotted versus duration of the repolarization step. Single exponential fit to determine reinhibition time constant and steady-state W(∞,V), according to the equation I n,rein. = W(∞,−100) + (1 − W(∞,−100))exp[−t/τ(V)], (τ = 20.4 ms). Protocols were repeated for interpulse voltage values of −40, −60, and −80 mV (not depicted). (A, right) State diagram depicting key features of “willing-reluctant” model of G-protein modulation of calcium channels. Highlighted arrows depict vertical rate constants most relevant to reinhibition protocol. (B, left) Variable-duration prepulse protocol used to determine time course of facilitation and elicited currents are shown. (B, middle) Normalized test pulse currents were measured 5 ms into the test pulse (0 mV) and plotted versus duration of prepulse (100 mV). Single exponential fits were determined using a least squares fit method to obtain a time constant and W(∞,V) values using the following equation I n,facil. = W(∞,100) + [W(∞,−100) − W(∞,100)]exp[−t/τ(V)], (τ = 8.3 ms). Protocols were repeated for prepulse voltage values of 40, 60, and 80 mV (not depicted). (B, right) State diagram with highlighted vertical arrows reflecting rates being measured by facilitation protocol. (C, left) Step protocol, with and without prepulse, used to determine time course and steady-state level of binding for given test pulse. Test pulse in exemplar is 0 mV. Step protocols were obtained from −30 to 30 mV. (C, middle) Dual fits of traces with and without a prepulse were fit using a least squares method: I +pre = I max[W(∞,V) + (1 − W(∞,V)) e−t/ τ(V)] e−t/τinact. I -pre = I max[W(∞,−100) + (W(∞,V) − W(∞,−100)) (1 − e−t/ τ(V))] e−t/τinact; (τ = 57.0 ms). (C, right) State diagram modeling G-protein modulation with highlighted arrows depicting rates measured.

