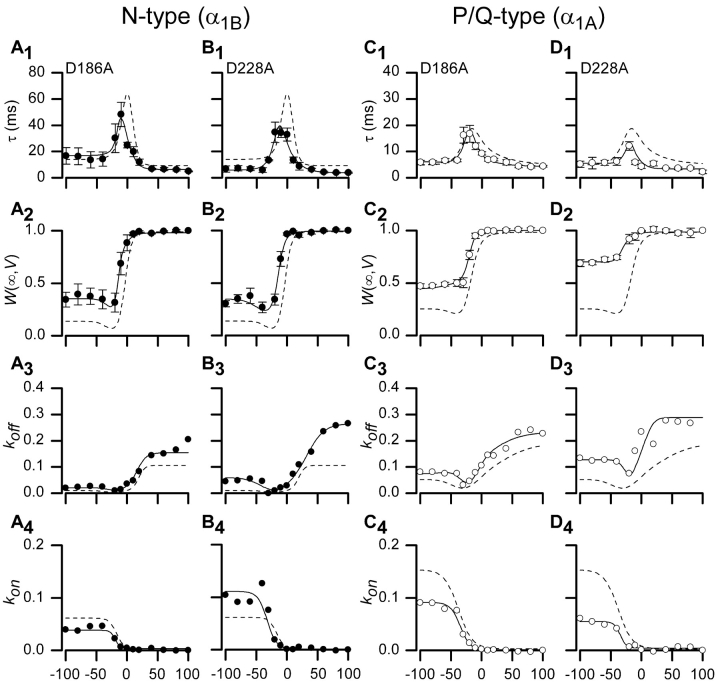
Figure 8.
Measured parameters and fits for Gβ1 mutations D186A and D228A. Time constants, τ(V), fraction of channels in willing mode, W(∞,V), and on and off rates are shown along with fits for two mutations found on the western region of Gβ1, D186A and D228A. N-type channel data is shown in A and B; P/Q-type channel data is shown in C and D. Dashed lines represent wild-type Gβ1 data for each particular channel type. Format identical to Fig. 3, D1–D4.

