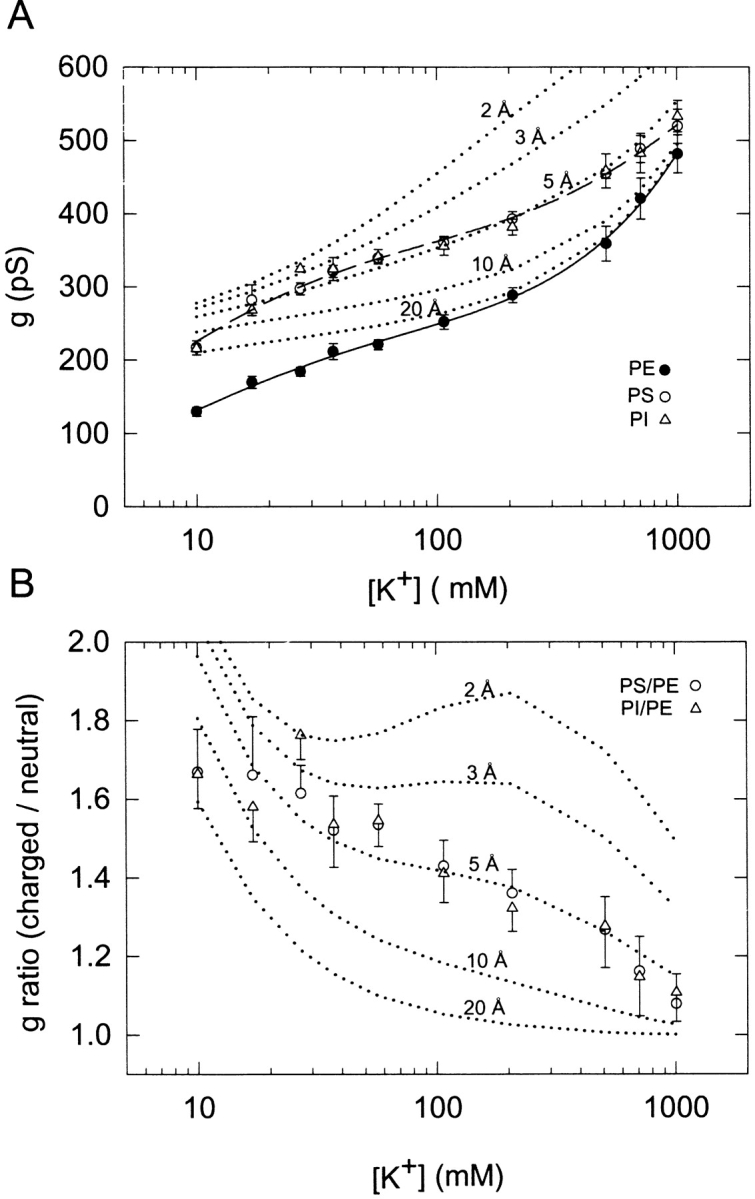
Figure 2.

Unitary conductance of the rat BK channel as function of symmetrical K+ concentration in PE, PS, and PI bilayers. (A) Conductance versus [K+]. Single-channel conductance was measured in PE, PS, or PI bilayers as described in Fig. 1. Data points correspond to the mean ± SE for 3–11 single channels. The solid line and dashed lines are respective nonlinear fits of the PE and PS data to Eq. 7 in the text. The model and best-fit parameters are given in Table I. The dotted lines are computed simulations based on Eq. 7 and the best-fit parameters for the PE data listed in Table I using [K+]local at various distances (2, 3, 5, 10, and 20 Å) from a PS membrane as calculated according to GCS theory given in materials and methods. (B) Ratio of conductance data plotted in A for comparison of PS/PE or PI/PE bilayers vs. [K+]. The dotted lines are the ratio of the individual dotted line simulations in A to the fitted curve for the PE data in A.
