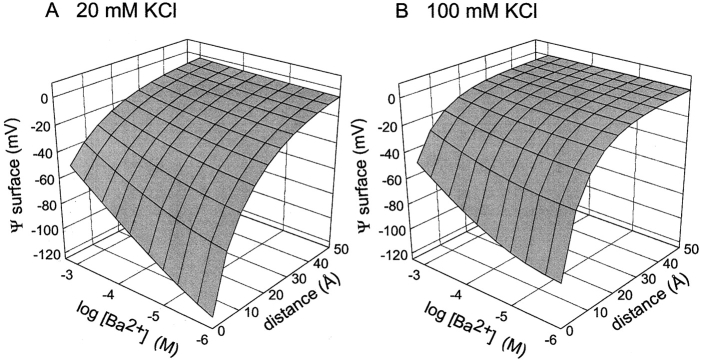
Figure 5.
Three-dimensional plot of electrostatic surface potential at various distances from a membrane composed of 80% PS and 20% PE. Surface potential was calculated at 5-Å intervals in the range of 0 to 50 Å from the membrane surface at 20 mM KCl (A) or 100 mM KCl (B) in the presence of different bulk BaCl2 concentrations ranging from 10−6 to 10−3 M using GCS theory described in materials and methods.

