
Figure 7.
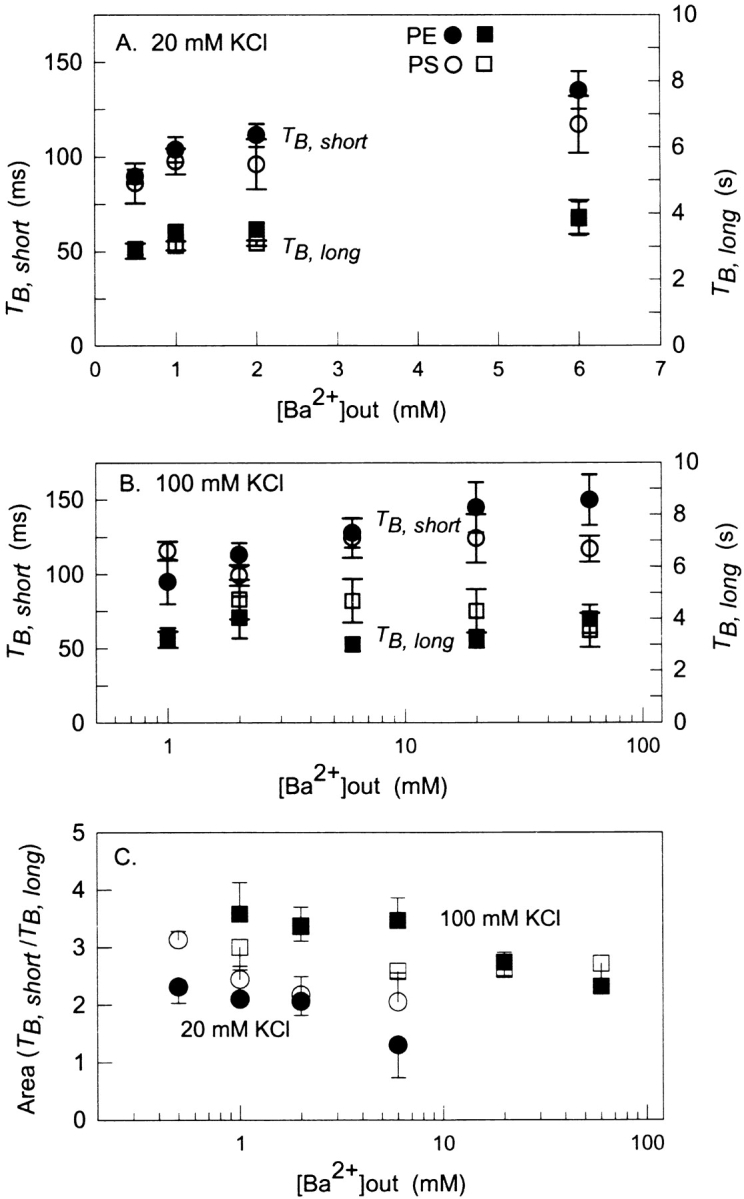
Lifetimes of blocked state events as a function of external Ba2+ concentration compared for PE and PS bilayers. (A and B) Mean values of short (circles) and long (squares) lifetimes of Ba2+-blocked events in PE (filled symbols) and PS (open symbols) bilayers measured at various concentrations of external Ba2+ in the presence of 20 mM (A) or 100 mM (B) symmetrical KCl. (C) Corresponding plot of the ratio of the amplitudes of the short lifetime component to the long lifetime component at 20 mM KCl (circles) and 100 mM KCl (squares). Data points and error bars represent the mean ± SE of 3–9 experiments.