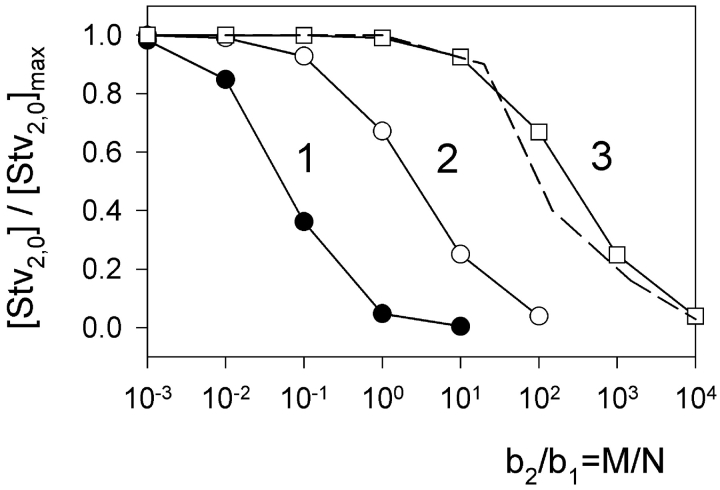
Figure 10.
Theoretical dependence of the equilibrium concentration of a complex of streptavidin with two gA5XB molecules at the membrane surface ([Stv2,0]) on the concentration of biotin-PE in the membrane. The calculations were performed by solving the system of equations (A11) numerically with the following parameters: c 1 = 1, b 1 = 103, c 2 = 102 (curve 1), c 2 = 1 (curve 2), and c 2 = 10−2 (curve 3). The dashed line is an averaged experimental curve from the data presented in the inset to Fig. 8 B.

