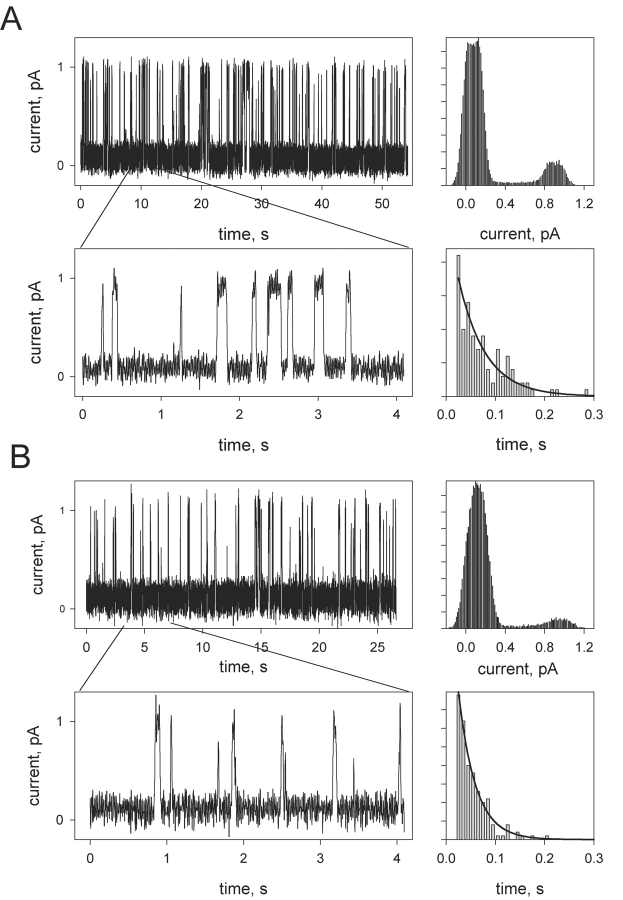
Figure 3.
(A) Fast fluctuations of the gA5XB single-channel current after the addition of 1 μg/ml streptavidin to both sides of a BLM observed before the appearance of the events shown in Fig. 1 B. (Top right) The corresponding current amplitude histogram. (Bottom right) The open state duration histogram with the exponential fit (the characteristic time is 55 ms). (B) Fast fluctuations of the gA2XB single-channel current after the addition of 1 μg/ml streptavidin to both sides of a BLM. (Top right) The corresponding current amplitude histogram. (Bottom right) The open state duration histogram with the exponential fit (the characteristic time is 35 ms). The BLM voltage was 50 mV. The solution was the same as in Fig. 1. Planar bilayers were from DPhPC. The low-pass digital filter with a cutoff frequency of 53 Hz was used in these recordings.

