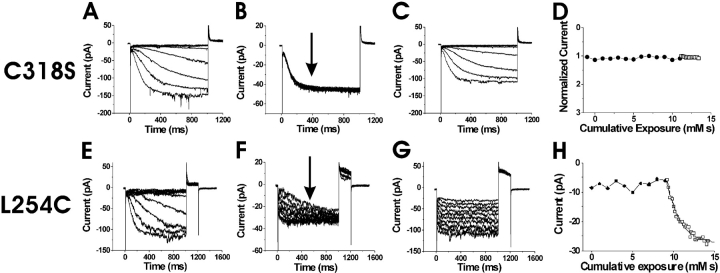
Figure 4.
State-dependent accessibility of L254C. (A–D) Application of MTSEA on the background channel HCN1 C318S. Currents before (A), during (B), and after (C), the intracellular application of MTSEA onto inside-out patches expressing HCN1 C318S mutants. In A and C the voltage steps occur in −10-mV increments from 0 to −120 mV. In B, the current trace is from a voltage step from 0 to −120 mV for 1 s during the application of 100 μM MTSEA. The voltage steps occurred every 2 s. (D) Currents measured at the arrow in B as a function of cumulative exposure to MTSEA. Modification rates for MTSEA at 0 mV (•) and at −120 mV (○). (E–H) State-dependent accessibility of L254C. Currents before (E), during (F), and after (G) the application of 100 μM intracellular MTSEA. In E and G, the voltage steps occur in 10-mV increments from −40 to −150 mV. In F, voltage was held at 0 mV and then stepped to −120 mV for the test pulse, followed by a step to +50 mV for tail currents. The holding potential was −120 mV. The patch was excised into a bath solution containing 100 μM MTSEA. (H) Currents measured at the arrow in F as a function of cumulative exposure to MTSEA. Modification time course for intracellular MTSEA at 0 mV (•) and −120 mV (□). The current amplitudes are plotted versus cumulative exposure to MTSEA and MTSET, in D and H, respectively. The bold line is an exponential fit to the data in H.

