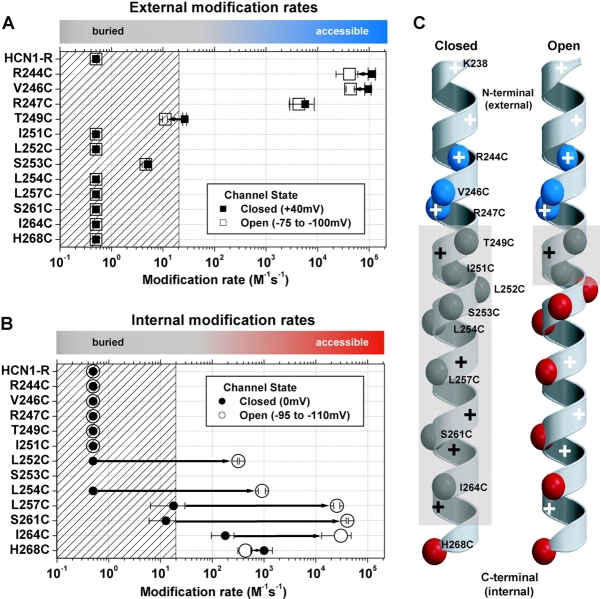
Figure 5.
A summary of external (A) and internal (B) MTSET second order reaction rates for HCN1-R and each of the Cys substitution mutant channels for both closed state (filled symbols) and open state (open symbols) exposure. Mean ± SEM reaction rates (3–6 experiments) were plotted on a Log10 scale for each Cys substitution mutant. The fastest modification rate on each graph (2.12 × 10⁵ s−1M−1) defines the reaction rate of MTSET with free sulfhydryls in aqueous solution (Pascual and Karlin, 1998). The hatched area on each plot represents modification rates that are ≤20 s−1M−1, a conservative guide-line based on the range of reactivity for Cys substitutions buried in the interior of globular proteins (∼50 s−1M−1, A. Karlin, personal communication). Colored bars at the top of each plot highlight this accessibility/buried definition: gray corresponds to buried Cys substitutions; blue corresponds to externally accessible Cys residues; red corresponds to internally accessible Cys substitutions. We arbitrarily assigned a modification rate of 0.5 s−1M−1, our lower limit of detection, to residues that failed to show significant reactivity (see materials and methods). (C) α-Helical diagrams summarizing the reactivity of Cys substitutions. Each of the α-carbons of the Cys substitutions are color-coded according to their accessibility as above. The gray, semiopaque areas delineate the region of the S4 α-helix that is protein and/or lipid buried. Positively charged residues are highlighted by plus symbols: black and white plus symbols indicate buried or accessible residues, respectively.

