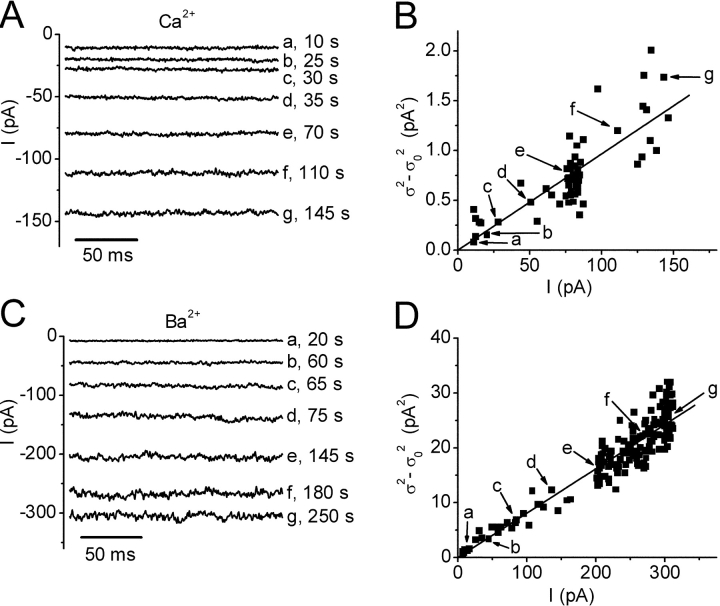
Figure 6.
Noise analysis of divalent currents. Pipette solution 9. Currents at varying times, indicated to the right of each trace, in exemplary experiments with 20 mM Ca2+ (A) and 20 mM Ba2+ (C). Data were recorded at 5 kHz sampling and post-filtered at 1 kHz. Currents are shown during the last 180 ms of a 660 ms pulse to −110 mV. Ba2+ currents were corrected for ∼3% residual activation by subtraction of a linear function. This procedure did not significantly affect the value of single-channel current. (B, D) Variance analysis of Ca2+ and Ba2+ currents. Background-subtracted variances (σ2 − σ0 2) plotted as a function of the mean current during the development of Ca2+ current (B) or Ba2+ current (D). Background variance was between 0.5 and 0.6 pA2 in five experiments. The labeled points correspond to traces in A and C. Data are fitted by a linear function (n = 58, correlation coefficient 0.81 for Ca2+; and n = 189, correlation coefficient 0.95 for Ba2+). The slopes indicate a single channel current i of 9.7 ± 0.4 fA for Ca2+ and 80.8 ± 0.8 fA for Ba2+.

