Figure 1.
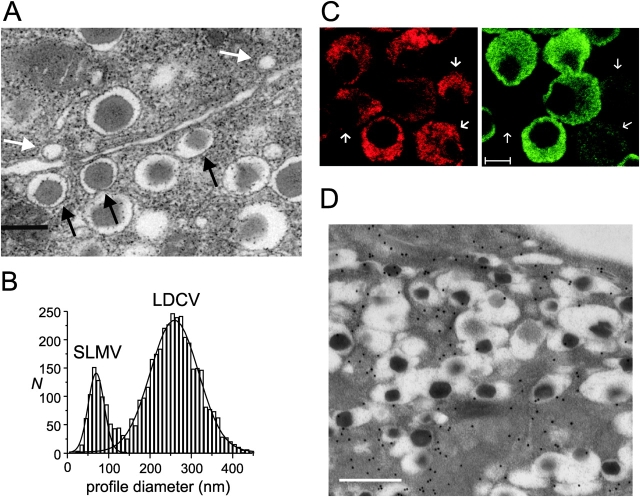
Localization of GABA and β-cell ultrastructure. (A) Electron micrograph of a rat pancreatic islet. Three docked insulin-containing LDCVs and two docked GABA-containing SLMVs have been highlighted by the black and white arrows, respectively. Bar, 250 nm. (B) Diameters of SLMVs and LDCVs in rat pancreatic β-cells. Two Gaussians have been approximated to the distribution of the profile diameters of the SLMVs and LDCVs. (C) Immunofluorescence micrograph of β-cells maintained in tissue culture for 24 h using specific antibodies against insulin (red, left) and GABA (green, right). Note the low GABA content of some β-cells (indicated by arrows). Bar, 5 μm. (D) Immunogold labeling of GABA in a β-cell in an intact islet. Bar, 500 nm.

