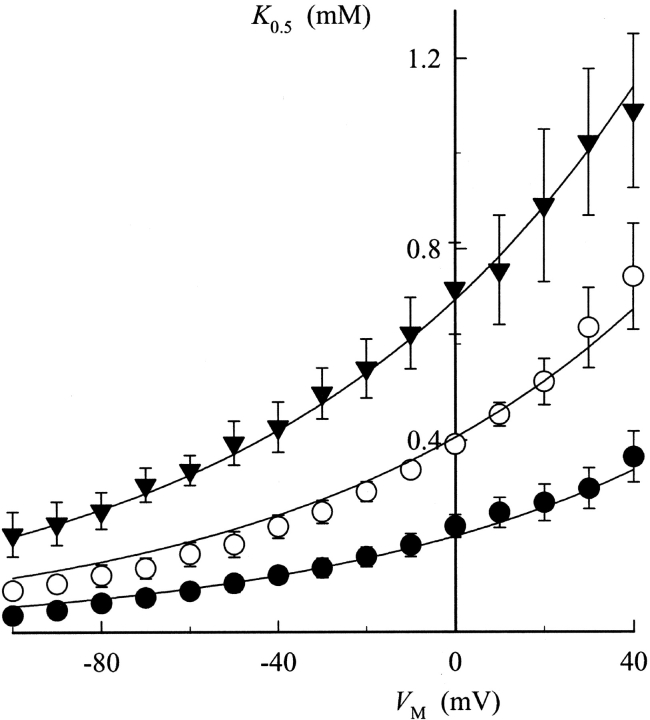
Figure 4.
Effect of TEA on the apparent K+ o affinity for activation of Na,K pump current. Na,K pump current was measured in the presence of 0 (•), 5 (○), and 25 mM TEA (▾) and K 0.5 values were calculated at each V M as described in the text. Curves are functions determined by simultaneously fitting all the data to Eq. 2 with γK fixed at a value of 0.55. The resulting parameter values for K 0 0.5, K 0 Q, γQ, λK, and λQ are listed in the text.

