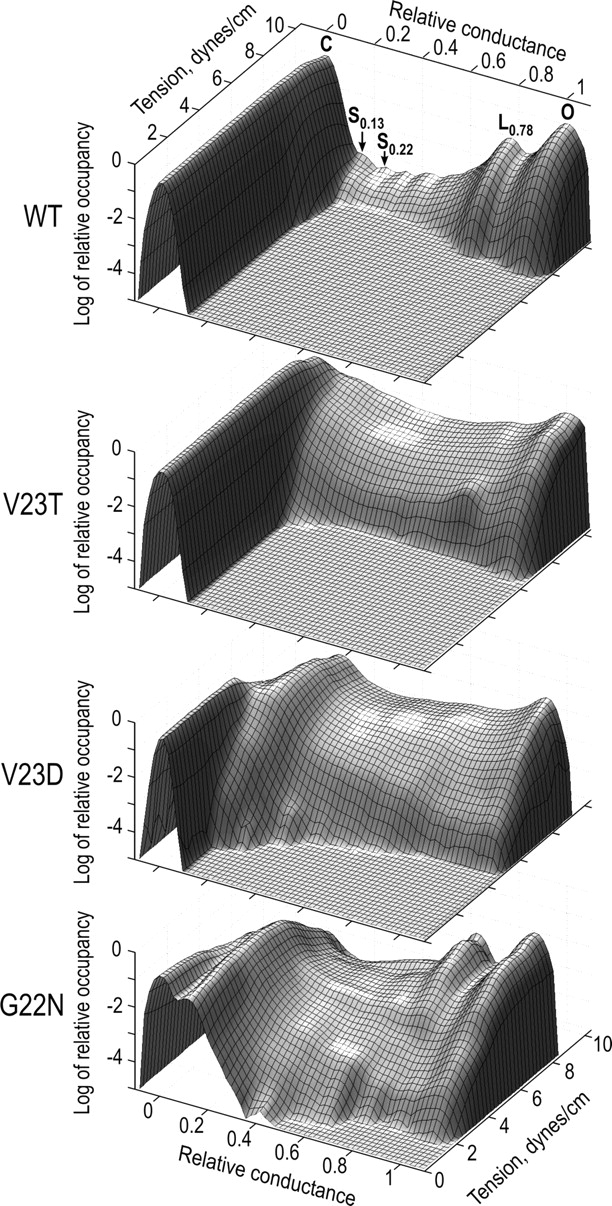
Figure 4.

Two-dimensional amplitude histograms for WT MscL and GOF mutants. The x axis, as in a regular amplitude histogram, represents the relative conductance, the y axis represents tension, and the z axis is the density of probability of occupying the specific conducting level. The ridges on the left and on the right represent the baseline and the fully open state, respectively. Note that in G22N, the most severe mutant, the low substate (ridge next to the baseline) is occupied at zero tension. The number of independent traces taken for analysis: WT, n = 10; V23T, n = 4; V23D, n = 6; and G22N, n = 3.
