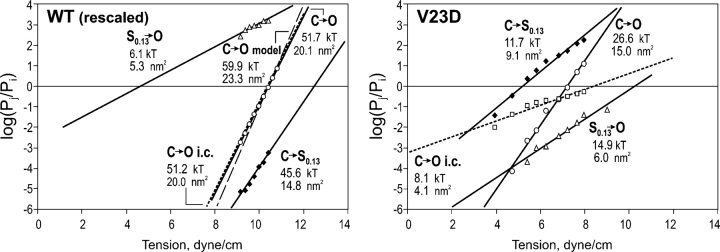
Figure 5.
Paired ratios of probabilities for the closed (C), low substate (S0.13), and the fully open state (O) for WT and V23D MscL, shown as functions of tension. Boltzmann fitting (straight solid lines) gives thermodynamic parameters of energy and in-plane area changes between the two particular states. Squares and dotted lines represent dose–response curves determined with integral current. For the V23D mutant, the integral current curve has much lower slope than the dose–response determined from the ratio of O and C occupancies. The data for WT were rescaled to satisfy the total expansion of 20.4 nm2, experimentally determined from initial slopes of dose–response curves (Chiang et al., 2004). The gray dashed line on the left panel represents the dose–response curve predicted from molecular models with parameters ΔA = 23.3 nm2 and ΔE = 59 kT.

