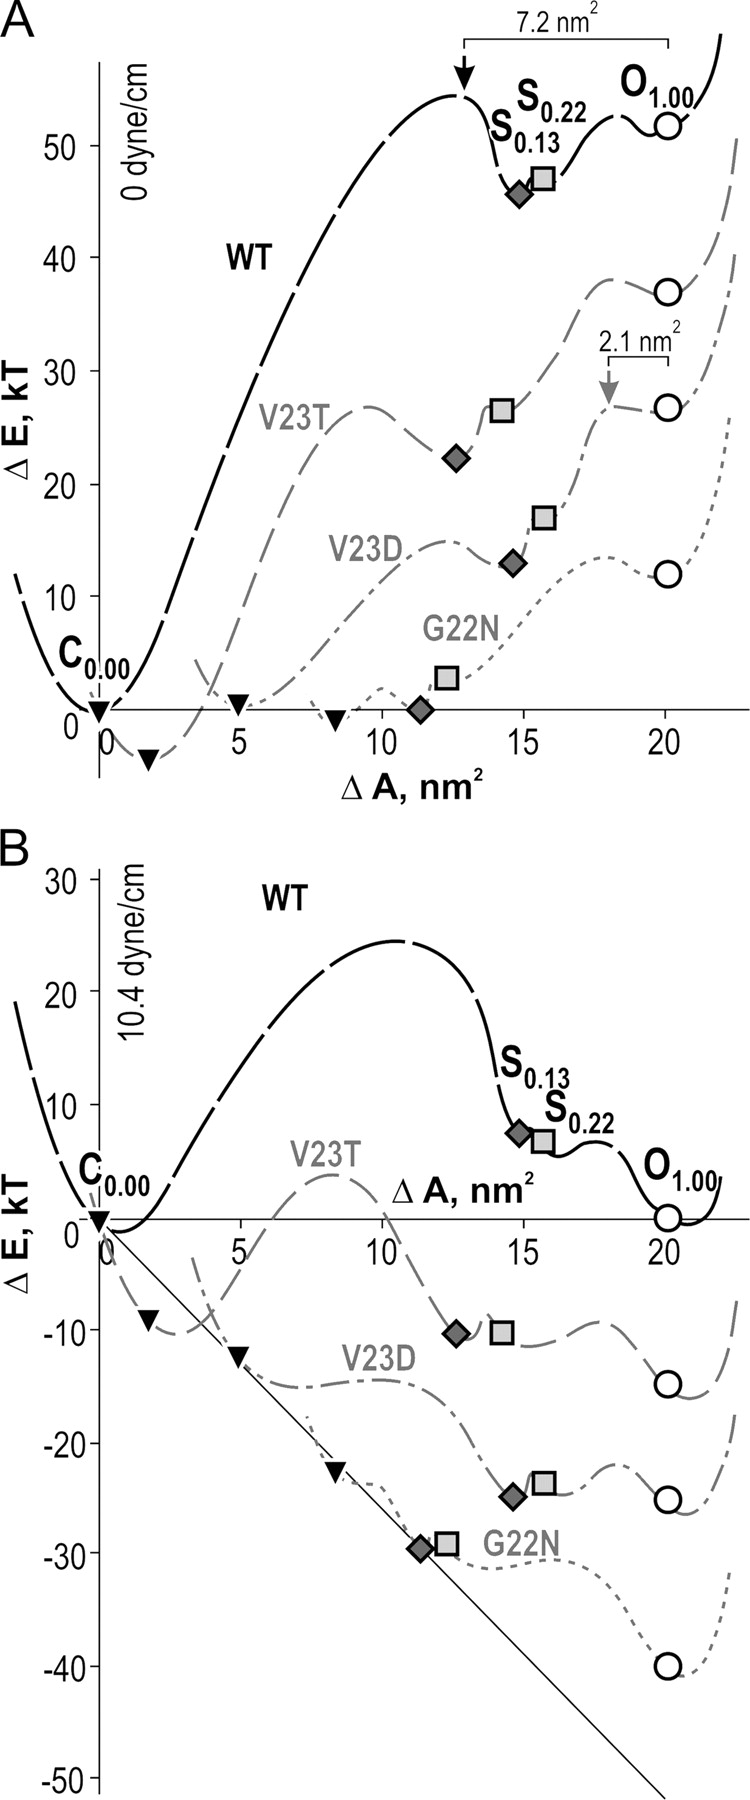
Figure 9.

Energy-area profiles for WT MscL and the four mutants reconstructed with the positions of wells for the states presented in Table I. The absolute heights of the separating barriers are inferred. The distances between the curves on the energy axis were estimated from differences in hydration energies of the primary side chains and that of substitutes. The positions of energy barriers for WT and V23D mutants were determined from the kinetic analysis (Fig. 6). The profiles calculated for zero tension (A) and for tension of 10.4 dyne/cm (B). The symbols represent closed states (▾), S0.13 (⋄), S0.22 (□), and open states (○).
