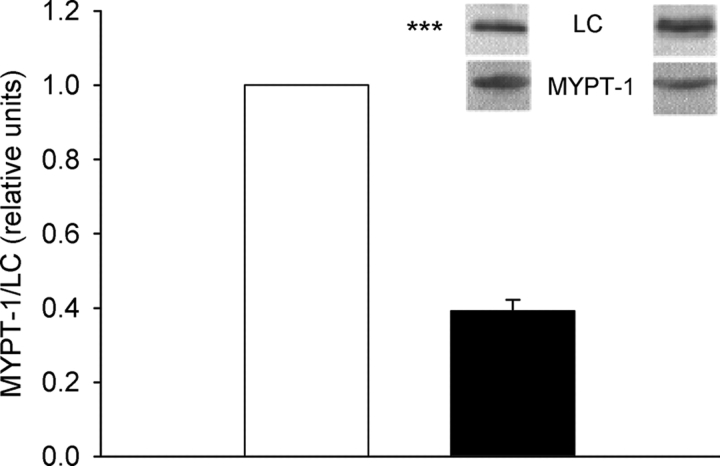
Figure 8.
MYPT-1 and myosin regulatory light chain (LC) ratio in adult (open bar) and newborn (filled bar) tissue (n = 7). Samples from adult and newborn tissue were analyzed in parallel and subjected to Western blot analysis using antibodies against the regulatory light chain and the MYPT-1 subunit. The ratio MYPT-1/LC chemiluminescent signal of the adult tissue was set to 1. Photos of Western blots are presented above the bar diagram (left photos, adult; right, newborn).

