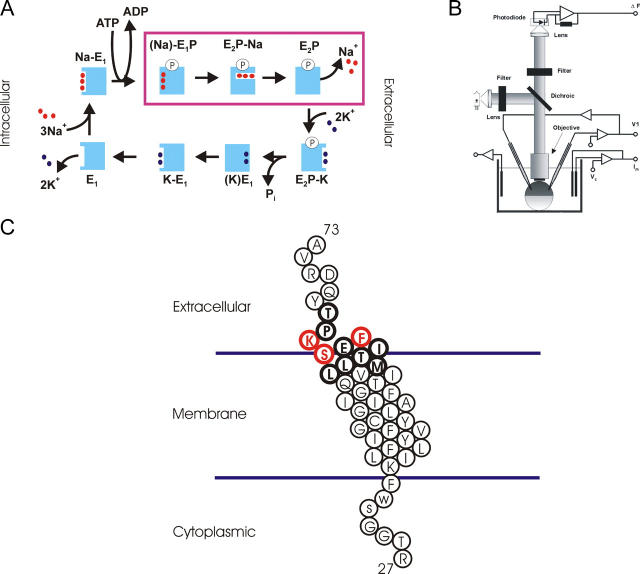
Figure 1.
(A) Albers-Post scheme for the Na+/K+ ATPase reaction cycle. (B) Scheme of the experimental setup used for voltage-clamp fluorometry. (C) Schematic diagram of the transmembrane domain and adjacent residues of the sheep β1 subunit of the Na+/K+-ATPase. The diagram depicts residues Arg-27 to Ala-73; in bold are shown the 11 residues Met-57 to Tyr-67, which were individually replaced by cysteines for the purpose of site-directed fluorescence labeling. Three residues that demonstrate significant fluorescence changes in response to voltage pulses are colored red.

