
Figure 5.
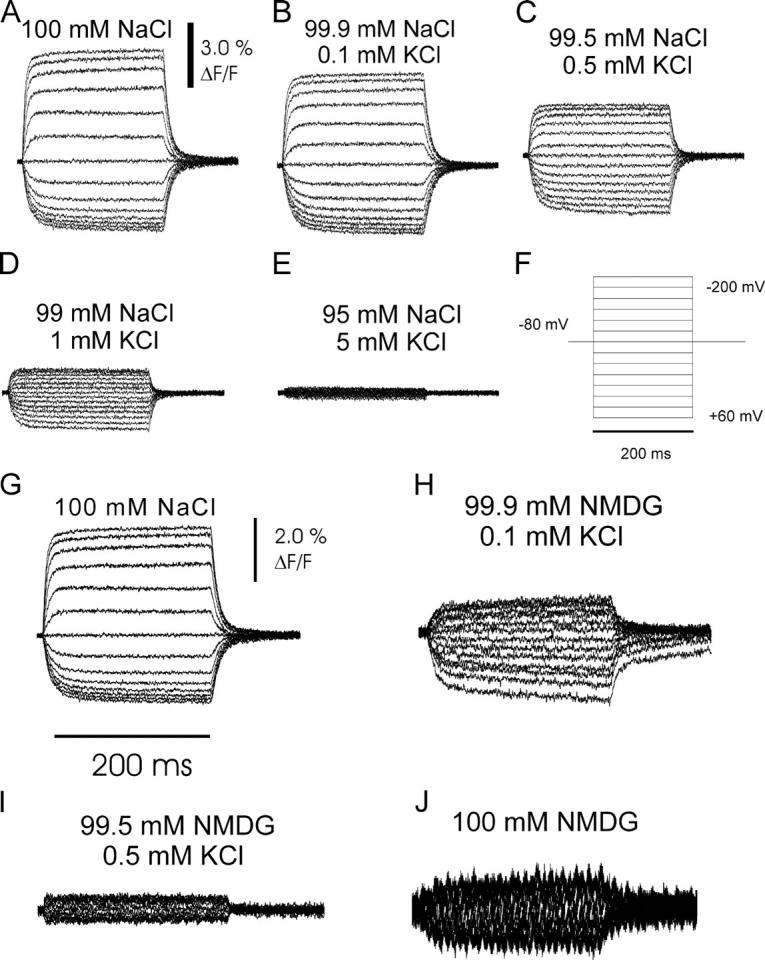
Voltage pulse–induced fluorescence responses at different extracellular Na+ and K+ concentrations from oocytes coexpressing the α subunit construct sNaKα1, ØCys together with sβ1-S62C. (A–E) K+ titration in presence of Na+. Data were consecutively recorded from a single oocyte after changes to perfusion buffers with the following Na+/K+ contents: (A) 100 mM Na+ (no K+), (B) 99.9 mM Na+ and 0.1 mM K+, (C) 99.5 mM Na+ and 0.5 mM K+, (D) 99 mM Na+ and 1 mM K+, and (E) 95 mM Na+ and 5 mM K+. F shows the applied voltage protocol for all data traces shown in this figure. (G–J) K+ titration in presence of NMDG. Voltage pulse–induced fluorescence responses from a single oocyte experiment at different Na+/NMDG/K+ concentrations: (G) 100 mM Na+ (no K+, for control), (H) 99.9 mM NMDG and 0.1 mM K+, (I) 99.5 mM NMDG and 0.5 mM K+, and (J) 100 mM NMDG.