

Abstract
High conductance, calcium- and voltage-activated potassium (BK) channels are widely expressed in mammals. In some tissues, the biophysical properties of BK channels are highly affected by coexpression of regulatory (β) subunits. β1 and β2 subunits increase apparent channel calcium sensitivity. The β1 subunit also decreases the voltage sensitivity of the channel and the β2 subunit produces an N-type inactivation of BK currents. We further characterized the effects of the β1 and β2 subunits on the calcium and voltage sensitivity of the channel, analyzing the data in the context of an allosteric model for BK channel activation by calcium and voltage (Horrigan and Aldrich, 2002). In this study, we used a β2 subunit without its N-type inactivation domain (β2IR). The results indicate that the β2IR subunit, like the β1 subunit, has a small effect on the calcium binding affinity of the channel. Unlike the β1 subunit, the β2IR subunit also has no effect on the voltage sensitivity of the channel. The limiting voltage dependence for steady-state channel activation, unrelated to voltage sensor movements, is unaffected by any of the studied β subunits. The same is observed for the limiting voltage dependence of the deactivation time constant. Thus, the β1 subunit must affect the voltage sensitivity by altering the function of the voltage sensors of the channel. Both β subunits reduce the intrinsic equilibrium constant for channel opening (L 0). In the allosteric activation model, the reduction of the voltage dependence for the activation of the voltage sensors accounts for most of the macroscopic steady-state effects of the β1 subunit, including the increase of the apparent calcium sensitivity of the BK channel. All allosteric coupling factors need to be increased in order to explain the observed effects when the α subunit is coexpressed with the β2IR subunit.
Keywords: BK channel, β subunits, allosteric model, voltage dependence, apparent calcium sensitivity
INTRODUCTION
The high conductance, voltage- and calcium-activated potassium channel (BK or MaxiK channel) is widely expressed among mammalian tissues (Toro et al., 1998). Its open probability increases on membrane depolarization or an increase in intracellular calcium concentration. As its activation leads to membrane hyperpolarization, it serves as a negative-feedback mechanism for the excitatory events that lead to increases in calcium concentration or raise the membrane potential. In vascular smooth muscle cells, BK channels play a key role in regulating the contractile tone (Nelson and Quayle, 1995; Brenner et al., 2000b); in chromaffin cells these channels help terminate the action potential and thus they modulate secretion (Neely and Lingle, 1992; Solaro et al., 1995), and in neurons BK channels colocalize with voltage-dependent calcium channels and are involved in the control of neurosecretion (Sah and Davies, 2000).
The BK channel is a homotetramer of its pore-forming α subunit, which is coded by the gene Slo1 (KNCMA1) and is a member of the voltage-dependent potassium (Kv) channels superfamily. As in all other Kv channels, the S4 transmembrane segment is (or is part of) an intrinsic voltage sensor (Diaz et al., 1998; Cui and Aldrich, 2000). Gating and ionic currents in BK channels can be elicited by membrane depolarization in the absence of calcium, suggesting that this is a voltage-dependent channel (Stefani et al., 1997). The divalent cation acts as a modulator able to decrease the necessary energy to open the channel, promoting a leftward shift in the open probability (P (O)) vs. voltage relationships. Therefore, as calcium is increased, less voltage is needed to activate the channel. The channel is also activated by intracellular Mg2+, whose binding sites are also low affinity binding sites for Ca2+ (Shi and Cui, 2001; Zhang et al., 2001).
Although only one gene codes for the BK channel (Slo1, KCNMA1), a wide variety of channel phenotypes has been found. These phenotypes differ in their calcium and voltage sensitivity as well as in their macroscopic kinetics. This variety is explained by several regulatory factors, including alternative splicing, protein phosphorylation, and, most importantly, coexpression of tissue-specific accessory proteins, called β subunits (for review see Orio et al., 2002). Four β subunits have been cloned, termed β1–β4 (Knaus et al., 1994; Wallner et al., 1999; Xia et al., 1999; Behrens et al., 2000; Brenner et al., 2000a; Meera et al., 2000; Uebele et al., 2000). The effects of the β1 subunit coexpression include an increase of the apparent calcium sensitivity, a decrease of the voltage dependence of the channel, and a slow down of the macroscopic kinetics (McManus et al., 1995; Meera et al., 1996; Cox and Aldrich, 2000; Nimigean and Magleby, 2000; Qian and Magleby, 2003). The β1 subunit also modulates the interaction of the channel with toxins and other activators (Dworetzky et al., 1996; Hanner et al., 1997; Valverde et al., 1999). The β2 subunit has an N-type or fast inactivation motif in its NH2 terminus, causing BK currents to inactivate when this subunit is present (Wallner et al., 1999; Xia et al., 1999). Besides this, the β2 subunit also enhances BK channel's calcium sensitivity, in a very similar way to that of the β1 subunit. The β3 subunit has four splice variants. Three of them confer some degree of inactivation to BK currents, and they also produce an outward rectification of the open channel currents (Brenner et al., 2000a; Xia et al., 2000; Zeng et al., 2001). None of the β3 subunits have any effect on the apparent calcium sensitivity of the channel. Finally, the β4 subunit has the opposite effect as the β1 subunit, decreasing the apparent calcium sensitivity of the BK channel (Brenner et al., 2000a; but see Ha et al., 2004). This subunit also slows down the macroscopic kinetics of the channel.
Detailed studies of the modulation of the apparent calcium sensitivity have been carried on for the β1 subunit. These studies strongly suggest that the β1 subunit affects the functional coupling between calcium binding and channel opening rather than the calcium binding affinity (Cox and Aldrich, 2000; Nimigean and Magleby, 2000). It is unclear at present whether or not the other β subunits modify the apparent Ca2+ sensitivity through a mechanism similar to that proposed for the β1 subunit.
The synergistic activation of the BK channel by two different stimuli (increases in intracellular calcium and membrane depolarization) has been shown to be rather complex, leading to the proposition of different kinetic schemes of up to 250 states and even more (for review see Magleby, 2003). One of the key features that define the behavior of BK channel is that neither calcium nor voltage is strictly necessary for channel activation. In the virtual absence of calcium, the channel is activated by large depolarization (Meera et al., 1996; Cui et al., 1997; Stefani et al., 1997), and when all voltage sensors are resting, the open probability of the channel can be increased by augmenting intracellular calcium (Horrigan and Aldrich, 2002). Even in the absence of both stimuli (in very low calcium and at very negative potentials), the channel still opens with a very low, but measurable, open probability (∼10−6) and a low voltage dependence not related to the voltage sensor (Horrigan et al., 1999; Horrigan and Aldrich, 2002). This, and several other observations, including macroscopic and single channel kinetics, led to the idea that both calcium and voltage increase the open probability by an allosteric mechanism (Horrigan et al., 1999; Rothberg and Magleby, 1999, 2000; Cui and Aldrich, 2000; Talukder and Aldrich, 2000; Horrigan and Aldrich, 2002). In this type of mechanism, neither voltage sensor movement nor calcium binding are strictly coupled to channel opening; these three processes are independent equilibriums that interact allosterically with each other. The existence of at least two and maybe three calcium binding sites with different affinities (Zhang et al., 2001; Xia et al., 2002) makes the picture more complicated and raises, almost exponentially, the number of states in a model.
The best compromise between simplicity and reproduction of the voltage and calcium dependence in a wide range of voltages and calcium concentrations, including very low open probabilities, is probably achieved by a 70-state allosteric activation model (Horrigan and Aldrich, 2002). This model (also explained in Fig. 1) takes into account two voltage dependences, one for the channel opening itself and one for the voltage sensor movement, and only the high-affinity calcium dependence. It also includes some allosteric interaction between calcium binding and voltage sensor movement. The open probability at any voltage and calcium concentration is given by the equation
 |
(1) |
where
 |
 |
 |
Figure 1.

Allosteric activation model for BK channel. (A) The allosteric activation by calcium originates a 10-state Monod-Wymann-Changeaux (MWC) activation model. For each calcium binding site occupied, the equilibrium constant for channel opening (L) is multiplied by the allosteric factor C. The same factor multiplies the calcium binding equilibrium constant (K) when the channel is open. (B) The allosteric activation by voltage also originates a 10-state MWC model. In this case, the allosteric factor is D and the equilibrium constant for voltage sensor activation is J. (C) The combination of A and B originates a two-tiered, 50-state model. (D) The complete 70-state model takes into account some interaction between voltage sensor activation and calcium binding (allosteric factor E). Note that when E = 1, the model reduces to 50-state as in C (modified from Horrigan and Aldrich, 2002).
V h(J) is the voltage for J = 1 (the half-activation voltage of each voltage sensor) for the closed channel, with no calcium bound and at V = 0. L 0 is the equilibrium constant for channel opening with all voltage sensors in resting state, with no calcium bound and at V = 0. K d is the dissociation constant of a single calcium binding site, for the closed channel and with all voltage sensors in resting state. z J and z L are the voltage dependences for J and L, respectively. C, D, and E are the allosteric factors.
In this paper, we present a detailed study of the effects of the β1 subunit and the β2 subunit without the inactivation domain (β2IR) on the calcium and voltage dependence of the BK channel. We focus on how the β subunits affect the voltage dependence of channel activation, as no previous study has shown whether the β1 subunit affects either the voltage sensor–associated or the voltage sensor–independent voltage dependence of the BK channel. Our results show that the β1 subunit, but not the β2IR subunit, has an important effect on the voltage sensor–associated voltage dependence of the channel. This effect is very likely to be a reduction in the number of effective gating charges per voltage sensor or the voltage dependence of the sensors activation (from 0.51 to 0.3). Contrary to a previous report (Cox and Aldrich, 2000), only this reduction of the voltage dependence can account for most of the β1 subunit effects on the macroscopic steady-state behavior of the channel, including the enhanced apparent calcium sensitivity. In the case of the β2IR subunit, an increase of the allosteric coupling factors is needed to account for its effects, as well as some change in the calcium binding affinity. We also found that both β subunits reduce the intrinsic equilibrium constant for channel opening (L 0).
MATERIALS AND METHODS
Channel Expression
cDNAs coding for BK channel α subunit (KCNMA) from myometrium (GenBank/EMBL/DDBJ accession no. U11058), human β1 and β2 subunits (KCNMB1 and KCNMB2, GenBank/EMBL/DDBJ accession no. U25138 and AF099137) and β2 subunit without inactivation domain (β2IR) (Wallner et al., 1999) were provided by L. Toro (University of California at Los Angeles [UCLA], Los Angeles, CA). mMESSAGE mMACHINE (Ambion) in vitro transcription kit was used to obtain mRNAs. Channels were expressed in Xenopus oocytes using standard techniques (Stühmer and Parekh, 1995). For macroscopic current recordings, 0.75–2 ng of α subunit cRNA or a mixture of 0.5–1.5 ng (α subunit) and 2–3 ng (β subunit) was injected per oocyte. For limiting voltage dependence experiments, 30 ng (α subunit) or 12.5 ng (α subunit) + 25 ng (β subunit) was injected. The approximate molar ratio was at least 6:1 (β:α), ensuring saturation of β subunit.
Electrophysiological Recordings and Solutions
1–5 d after cRNA injection, currents were recorded using the inside-out configuration of the patch-clamp technique. All recordings were performed at room temperature (20–22°C). Intracellular (bath) and extracellular (pipette) solutions contained (in mM) 110 KOH, 10 HEPES, and 2 KCl, and were adjusted to pH 7.4 with methanosulfonic acid. Depending on the desired free calcium concentration, 1.8–3.5 mM CaCl2 and 5 mM EGTA (5–200 nM), HEDTA (0.68–12 μM), or NTA (22–150 μM) was added. Free calcium concentrations were calculated using the WinMaxChelator Software (http://www.stanford.edu/~cpatton/maxc.html) and checked with a calcium electrode (World Precision Instruments). For the solution designated as 5 nM, this is an upper estimation based on contaminating calcium. Depending on the magnitude of currents, and in order to minimize voltage drops due to series resistance, some experiments were done with solutions containing 36 mM KOH and 74 mM NMDG. The pipette solution contained 100 nM or lower free calcium.
Pipettes were pulled in a horizontal pipette puller (Sutter Instruments) from Corning 7740 (Pyrex) or Custom 8250 (Warner Instruments) borosilicate capillary glass. Pipette resistance was 0.8–2 MΩ in 110 K+, and series resistance error was always <10 mV.
Data were acquired with an Axopatch 200B (Axon Instruments) or an EPC-7 (List Medical) amplifier, filtered with an 8-pole Bessel filter (Frequency Devices) at 1/5 of the acquisition rate and sampled with a 16-bit A/D converter (NI-6036; National Instruments). Typical acquisition rates for macroscopic current recordings ranged from 66.6 to 100 kHz (α subunit alone) or from 16.6 to 40 kHz (α + β subunits). For unitary events quantification, recordings were sampled at 50 kHz for α and 20 kHz for α + β channels. A homemade acquisition software was developed in the LabView programming environment (National Instruments). Primary data analysis was performed with Analysis (UCLA) and Clampfit 9 (Axon Instruments) software.
Steady-state Activation Analysis
The Solver function of Microsoft Excel was used to fit instantaneous tail currents to a Boltzmann function of the form
 |
(2) |
where I max is the maximum obtained tail current, z is the voltage dependency of activation, V 0.5 is the half-activation voltage, T is the absolute temperature (typically 295 K), F is the Faraday's constant, and R is the universal gas constant. When [Ca2+] was <500 nM, only low conductances were achieved and the estimation of I max became unreliable. In those cases, G max was fixed using the value obtained with higher calcium concentrations in the same patch. All the analyses that follow were performed using I/I max values.
ΔG values were calculated for each experiment as −zFV 0.5. Mean ΔG values were plotted against calcium concentration and fitted to a concentration-effect sigmoid equation (Eq. 6). As we used calcium concentrations uniformly distributed in a logarithmic scale, the fit was performed using log([Ca2+]).
Statistical Analysis
To test whether a fit parameter was statistically different between two (or more) datasets, a global fit (null hypothesis, in which the parameter of interest was restricted to be equal among all datasets) was compared against an independent fit of each dataset (alternative hypothesis). Comparison between independent and global fits was done by an extra sum-of-squares F test, using the formula
 |
where SS and DF are the sum-of-squares and the degrees of freedom of the fit, respectively. glb and ind denote the global and the independent fit, respectively. All the analysis and the conversion of the F value to a P value were done with the GraphPad Prism software (GraphPad Software Inc.).
Single Channel Analysis
All-points amplitude histograms were obtained from 20–45 s recordings. For each histogram, NP (O) was calculated by measuring the fraction of time (P k) spent at each open level (k) using a half-amplitude criteria and summing their contributions NP (O) = ΣkP k. In some experiments, it was checked that the half-amplitude criteria method yields a similar result (<5% difference in NP (O)) than a Gaussian fit of the histograms. For voltages >50 mV, NP (O) was calculated from the macroscopic tail current measurement, dividing by the unitary conductance (220 pS) and the tail voltage. In some experiments, the number of channels in the patch (N) was calculated by raising the calcium concentration and performing a nonstationary noise analysis (Sigworth, 1980; Alvarez et al., 2002) or measuring total patch conductance between −10 and 10 mV when all channels were open. In this way, an absolute P (O) was obtained and was used to normalize and average the experiments.
Fit to the Allosteric Activation Model
For each calcium concentration, a mean V0.5 (<V0.5>) value was obtained. All the corresponding G/G max vs. V curves were displaced in the voltage axis by V0.5 − <V0.5>, allowing us to construct an average curve that preserved the shape of the individual curves at every [Ca2+]. Each of these curves comprised three to eight sets of 30 to 35 points that were converted to a 40-point set by a smoothing function in Sigmaplot 8.0. The families of G/V curves were simultaneously fitted to Eq. 1 by minimizing least-squares with a mixture of Marquardt-Levenverg and Simplex iterations in Origin Pro (OriginLabs). Several fits were attempted with different initial parameters and the fits with lower chi-squared were chosen.
RESULTS
Effect of β1 and β2IR Subunits on Steady-state Activation Parameters of BK Channel
Fig. 2 summarizes the voltage- and calcium dependence of the BK channel and how it is affected by the β1 and β2 subunits. We studied a truncated β2 subunit (Δ2-19β2, β2IR) that lacks the inactivation peptide. In the presence of the β2IR subunit, BK currents are sustained (compare Fig. 2 A, α+β2wt and α+β2IR) and therefore the effects of this subunit in the activation parameters of the BK channel are best studied.
Figure 2.

Effects of β1 and β2IR subunits on BK channel steady-state activation parameters. (A) Macroscopic currents recorded in the inside-out configuration at 5 nM (left) and 2.8 μM (right) intracellular calcium. The respective voltage protocols are shown at the bottom. (B) Averaged P (O)/V curves at 2.8 μM (triangles) and 5 nM Ca2+ (circles). n = 4–9. Lines are the best fit to a Boltzmann distribution (Eq. 2). Fit parameters are: α, V 0.5 = 209 mV, z = 0.89 (5 nM); V 0.5 = 42 mV, z = 1.54 (2.8 μM). α+β1, V 0.5 = 244 mV, z = 0.67 (5 nM); V 0.5 = −5 mV, z = 1.15 (2.8 μM). α+β2IR, V 0.5 = 190 mV, z = 0.96 (5 nM); V 0.5 = −33 mV, z = 1.59 (2.8 μM) (C) Average of the obtained V 0.5 values plotted against calcium concentration. (D) Average of the obtained z values plotted against calcium concentration. Error bars are SD, n = 4–7.
The effect of voltage on the steady-state open probability is measured by a fit of the tail current vs. voltage plots to a Boltzmann distribution (Eq. 2; Fig. 2 B). Increasing the calcium concentration lowers the half-activation voltage (V 0.5; Fig. 2 C). In the presence of both the β1 and β2IR subunits, the effect of calcium is enhanced, as the V 0.5 values for α+β1 and α+β2IR are lower than for α at [Ca2+] ≥ 1 μM. There are, however, noticeable differences between the β subunits. First, the V 0.5 values for α+β2IR are lower than for α+β1 at all calcium concentrations (P < 0.0001 in a two-way ANOVA test). Second, at [Ca2+] ≤ 100 nM, α+β1 channels have higher values than either α or α+β2IR channels (P = 0.003 compared with α, and P < 0.0001 compared with α+β2IR) while α+β2IR is not different from α (P = 0.2).
As the calcium concentration is increased >200 nM, the voltage dependence of the BK channel increases in the 0.1–10 μM range and then decreases again as the calcium concentration is further increased (Fig. 2 D). In the presence of the β1 and β2IR subunits, this behavior is maintained, but the β1 subunit shows lower z at all calcium concentrations (P < 0.0001 when compared with α with a two-way ANOVA test; P = 0.008 for [Ca2+] ≤ 100 nM). On the contrary, the β2IR subunit does not modify the voltage sensitivity of the channel (P = 0.27).
β1 and β2IR Subunits Do Not Change Calcium Binding Affinity
The changes in the V 0.5/[Ca2+] relationships may be interpreted as a change in the calcium binding affinity of the channel. It has been already proposed, however, that the β1 subunit acts by a mechanism different than enhancing the calcium binding to the channel (Cox and Aldrich, 2000; Nimigean and Magleby, 2000). The data we present below suggest that this is true for the β2IR subunit as well.
The Boltzmann distribution used to obtain the V 0.5 and z values is based on the simplifying assumption of a two-state model. In this model, the difference in free energy (ΔG) between the open and closed states of the channel is given by
 |
(3) |
Although the BK channel has more than two states, we can use Eq. 3 to obtain the overall energy difference between open and closed states. The V 0.5 and z values from Fig. 2 (C and D), as well as Eq. 3, were used to obtain the ΔG values plotted in Fig. 3 against calcium concentration (symbols). The ΔG/[Ca2+] relationship shows that calcium affects this energy difference in a simple concentration-dependent fashion. Therefore, the ΔG/[Ca2+] relationship can be fitted to an equation of the form
 |
(4) |
where ΔG 0 is ΔG in absence of calcium, ΔΔG Ca is the change in ΔG produced by calcium binding to the channel (in saturating calcium, ΔG = ΔG 0 + ΔΔG Ca), EC 50 is the half-effect concentration, and n is the slope or concentration dependence of the change. As our data span several orders of magnitude of calcium concentration and are evenly distributed in a logarithmic scale, it is more appropriate to express the calcium concentration and EC 50 as log[Ca2+] and logEC 50, respectively. Then
 |
(5) |
which can be reordered to
 |
(6) |
Figure 3.

ΔG vs. [Ca2+] relationships for BK channel. ΔG was calculated for each individual experiment as −zFV 0.5. Plotted values are mean ± SD (n = 4–9). Lines represent the best fit to a sigmoid concentration-effect curve (Eq. 6). Best-fit values are listed in Table I.
The continuous lines in Fig. 3 represent the best fit to Eq. 6, and the parameters for the best fit are listed in Table I. Clearly the β subunits only modify significantly the ΔΔG Ca parameter, while the rest of the parameters remain comparatively unaffected. In other words, the β1 or β2IR subunit coexpression only changes the effect of calcium on the energy difference, while neither the energy difference in absence of calcium nor the calcium binding parameters of BK channel are severely affected. The EC 50 and n values come from an empirical measurement of the calcium effect; therefore, they cannot be related directly to the K d or C parameters of the allosteric activation model. As will be shown below (see discussion), changes in parameters other than K d and C can affect the EC 50 of the ΔG/[Ca2+] plot. The obtained EC 50 value will be regarded as a measurement of the concentration range for the calcium effect and it is clear that neither the β1 nor the β2IR subunit affect it significantly. It has been already proposed that the β1 subunit acts by a mechanism different than enhancing the calcium binding to the channel (Cox and Aldrich, 2000; Nimigean and Magleby, 2000), and these data may suggest that this is true for the β2IR subunit as well.
TABLE I.
Parameters for the Best Fit of ΔG vs. [Ca2+] Values to Eq. 6
| α | α+β1 | α+β2IR | Pa | |
|---|---|---|---|---|
| ΔG 0, kcal/mol | 4.2 ± 0.2 | 4.1 ± 0.2 | 3.9 ± 0.2 | 0.45 |
| ΔΔGCa, kcal/mol | −5.5 ± 0.5 | −7.3 ± 0.5 | −8.9 ± 0.4 | <0.001 |
| logEC50 | 0.47 ± 0.1 | 0.18 ± 0.07 | 0.31 ± 0.04 | 0.07 |
| n | 0.9 ± 0.2 | 0.7 ± 0.1 | 1.1 ± 0.1 | 0.10 |
| EC50, μM | 2.96 (2.3–3.7) | 1.5 (1.3–1.8) | 2.06 (1.9–2.3) | – |
Values for the best fit are shown ± SEM. As the fit was done with log[Ca2+] values, a logEC50 was obtained. EC50 was calculated applying antilogarithm, and a range was calculated with the corresponding SEM values.
The P value is the result of an extra sum-of-squares F test that tested the null hypothesis of the parameter having the same value in the three fits. A high P value means that the three fits are likely to share a common value of the corresponding parameter.
The ΔG analysis presented in Fig. 3 and Table I also suggests that the β subunits do not affect ΔG 0, the energy difference between closed and open states when the channel is in absence of calcium. Therefore, the changes in V 0.5 that the β1 subunit produces in this condition must be due to a change in the voltage sensitivity, evidenced by the change in the z parameter. As the gating of BK channel has been shown to have two voltage-dependent processes, the movement of the voltage sensors and the opening of the pore gate (Horrigan and Aldrich, 1999; Horrigan et al., 1999), in the following experiments, we addressed whether the β1 and the β2IR subunits modulate any (or both) of these voltage dependences.
The β Subunits and the Limiting Slope for Voltage-dependent Activation
In voltage-dependent channels, the lnP (O)/V relationship becomes linear and reaches a maximum slope (known as limiting slope) at very low open probabilities. It has been shown (Almers, 1978; Sigg and Bezanilla, 1997) that for any linear voltage-dependent model
 |
(7) |
where Δq is the voltage sensor charge effectively coupled to channel activation and F, R, and T have their usual meanings. The BK channel departs from this behavior; it reaches a maximum slope of ∼2 at P (O) ∼ 10−3, but when the P (O) is further lowered, a lower slope of ∼0.3 is reached at P (O) < 10−6. This is one of many observations that led to the proposition of an allosteric mechanism for the voltage-dependent activation of the BK channel (Horrigan et al., 1999; Rothberg and Magleby, 1999). In this model, the opening of the channel has an intrinsic voltage dependence unrelated to the movement of the voltage sensors. The allosteric model is depicted in Fig. 1 B, where both the L (for channel opening) and J (for voltage sensor activation) equilibrium constants are voltage dependent. In the absence of calcium and at very negative potentials, all voltage sensors are in the resting state. In this condition, the model is confined to the C0–O0 equilibrium, governed by the equilibrium constant L. Then,
 |
(8) |
As L << 1, we can approximate P (O) ≈ L, and then
 |
(9) |
Therefore, for the BK channel the limiting slope is actually given by
 |
(10) |
where z L is the voltage dependence for the equilibrium constant L or the voltage dependence for channel opening.
We studied whether the β1 or the β2IR subunit have any effect on this behavior of the BK channel. To determine the limiting slope of the voltage dependence, we quantified single unitary opening events in patches containing hundreds and even thousands of channels, in conditions of very low open probabilities. Fig. 4 A shows the single channel activity of a patch containing ∼10,000 BK channels (α subunit alone) at three holding voltages. The opening events become less frequent at negative potentials as evidenced in the all-points histograms in Fig. 4 B (compare the ∼200 pS peaks at −60 vs. −120 mV). In the presence of the β1 and β2IR subunits (Fig. 4, C–F), a similar behavior was observed.
Figure 4.

Unitary events quantification at very low open probabilities. Inside-out patches containing hundreds of α (A), α+β1 (C), or α+β2IR (E) channels were exposed to the indicated membrane potentials in the virtual absence of intracellular calcium (5 nM). All-points histograms were constructed from 20–45-s recordings for α (B), α+β1 (D), and α+β2IR (F) channel containing patches. Amplitudes are expressed as conductance in pS.
Several single channel recordings as well as some macroscopic recordings were averaged (see materials and methods) to construct the semilogarithmic P (O)/V plots shown in Fig. 5 (A–C). All three plots tend to a limiting slope at very negative potentials that represents the z L parameter in the allosteric activation model. The value for α alone channels is very similar to that previously published by others (Horrigan et al., 1999; Horrigan and Aldrich, 2002). The presence of the β1 subunit seems to make the limiting slope higher (Fig. 5 B), however a derivative plot (Fig. 5 B, inset) shows that the actual limiting slope is not actually reached at −120 mV and that the actual value must be closer to 0.3. In the case of the β2IR subunit, the value is not statistically different to the z L of the α alone channel (P = 0.6 for different slopes). All plots have a maximum slope in the 0–100 mV range, which is related to the voltage sensor–associated activation of the channels and represents the limiting slope value that is achieved by macroscopic current methods (Diaz et al., 1998). The slope is similar for α and α+β2IR channels (P = 0.44), but for α+β1 it is lower (P = 0.001). These observations suggest that only the β1 subunit affects the voltage sensor–associated activation of the channel and none of the studied β subunits affects the intrinsic voltage dependence of the channel opening transition. To analytically check this assumption, we performed a fit of the P (O) relationships to the allosteric model for voltage dependence activation.
Figure 5.

Limiting voltage dependence for α, α+β1, and α+β2IR channels. Semilogarithmic P (O)/V plots for α (A), α+β1 (B), and α+β2IR (C) channels, obtained from unitary events quantification (V < 60 mV) or macroscopic recordings (V > 30 mV). Values shown are mean ± SD of 3–9 points, obtained from 8 (α and α+β2IR) or 9 (α+β1) different patches. In some cases, the SD bars fall within the symbols. Linear intervals were fitted to Eq. 9 and the corresponding z values are shown beside the plots. The inset in B shows a smoothed differential of the lnP (O)/V data, expressed as electronic equivalents (scaled by R×T/F). The straight dotted line marks the Y = 0.3 position while the dotted curve is a simple exponential fit of the data added as visual reference. (D) Simultaneous fit of the P (O)/V data to Eq. 11 restricting a shared z L value for all datasets (lines). Parameters for the best fit are listed in Table II. Symbols are the same experimental data shown in A–C.
In the absence of calcium, the allosteric model for voltage activation predicts that the open probability as a function of voltage is given by the equation
 |
(11) |
where L = L 0exp(z LFV/RT) and J = exp(z JF(V − V h(J))/RT). The parameters to be fitted are L 0, V h(J), z L, z J, and D (see introduction).
P (O) values from Fig. 5 (A–C) were fitted to Eq. 11. Before allowing the parameters to vary freely during the fit, we noted that previous works (Horrigan and Aldrich, 1999, 2002) showed that the half-activation voltage for voltage sensors (V h(J)) is around 150 mV. This assumption is confirmed in our study by the maximum of the τact/V plot (see Fig. 9 B), which is highly dependent on V h(J) (Horrigan et al., 1999). Moreover, this maximum is not affected by β subunit coexpression (Fig. 9 B). Therefore, we restricted V h(J) to be between 140 and 160 mV in all the fits. Based on the measured limiting slope, z L was restricted to be >0.25. Two fits were performed: one in which z L was free to vary in each dataset (α, α+β1, and α+β2IR) and a second one in which z L was restricted to be equal for the three datasets. An extra sum-of-squares F test yielded that a common z L cannot be discarded (P = 0.22) and was preferred for the following analysis. Fig. 5 D (lines) shows the best simultaneous fit with the same z L value and the parameters are listed in Table II.
Figure 9.
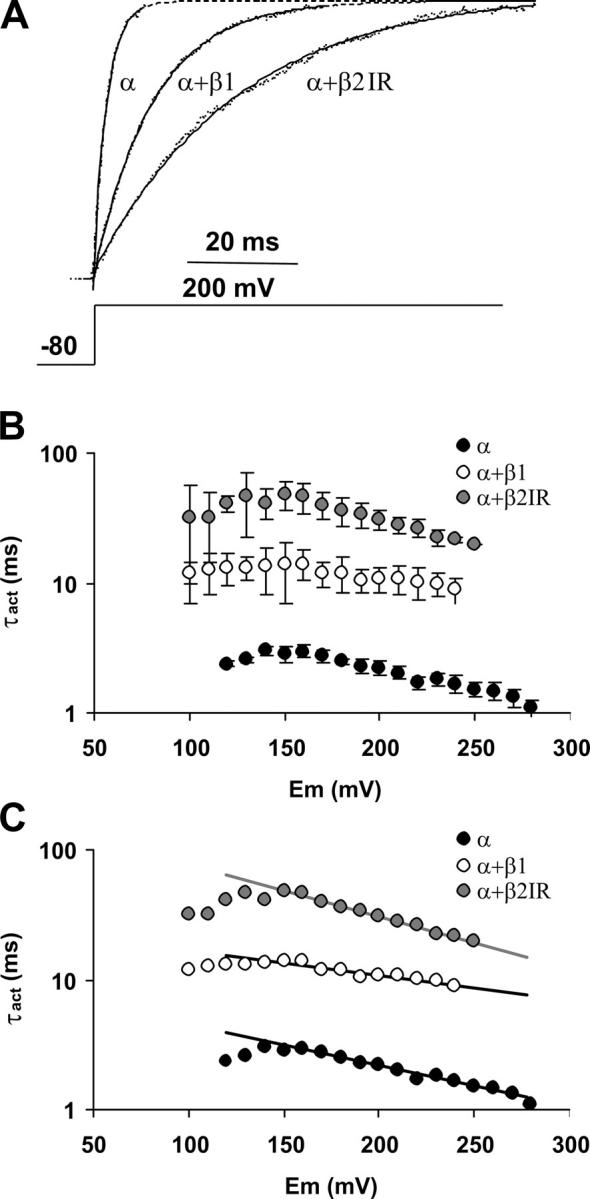
The β subunits and the voltage dependence of the activation kinetics in the absence of calcium. (A) Current traces evoked by a 200-mV pulse after a −80-mV prepulse. Current magnitude of each trace was normalized by the mean current at steady state. Over the traces, the best fit to an exponential raise is shown. For α and α+β1, the fit was extrapolated (segmented lines) to show that the traces are effectively normalized to the same maximum. (B) Activation time constant (τact) plotted against activation voltage. Symbols represent mean ± SD. n = 3–5. (C) The lineal range of each plot was fit to Eq. 15 with a negative z.
TABLE II.
| α | α+β1 | α+β2IR | |
|---|---|---|---|
| V 0.5(J), mV | 154 ± 11 | 140 ± 15 | 140 ± 9 |
| z J | 0.56 ± 0.03 | 0.37 ± 0.02 | 0.56 ± 0.02 |
| L 0 | 5.5 × 10⁻⁶ ± 2 × 10⁻⁶ | 3.1 × 10⁻⁷ ± 2 × 10⁻⁷ | 4.4 × 10⁻⁷ ± 2 × 10⁻⁷ |
| z L | 0.33 ± 0.12 | 0.33 ± 0.12 | 0.33 ± 0.12 |
| D | 14.4 ± 4.5 | 24.4 ± 8.9 | 29.4 ± 8.4 |
The fit was done minimizing the relative distances squared (1/Y2 weight) to give a better fit of the lower open probabilities. Values are for a simultaneous fit restricting z L to be equal among the datasets, and are shown ± SEM.
The L 0 parameter is greatly reduced in the presence of both β subunits, related to the lower P (O) values obtained at negative voltages. The reduction of L 0 is accompanied by an increase of the allosteric factor D, the functional coupling factor between the activation of the voltage sensors and channel opening. The effect on L 0 and D is a common feature of both β subunits, but a striking difference between them is that the β1 subunit has a noticeable effect on the z J parameter. Simulations performed with the allosteric model for voltage activation show that only a change in the z J parameter dramatically reduces the maximum slope of the ln(P (O))/V relationship (Fig. 6 B, top left). z J is the voltage dependence for the activation of the voltage sensors and it has been suggested to be equal to the number of apparent gating charges per sensor (Horrigan and Aldrich, 2002). In fact, this is a strict prediction of the allosteric model since it assumes that the voltage sensors can be either in a resting or in an active state (two-state model). In conclusion, the β1 subunit, but not the β2IR subunit, promotes a reduction of the voltage dependence of the voltage sensor movement.
Figure 6.
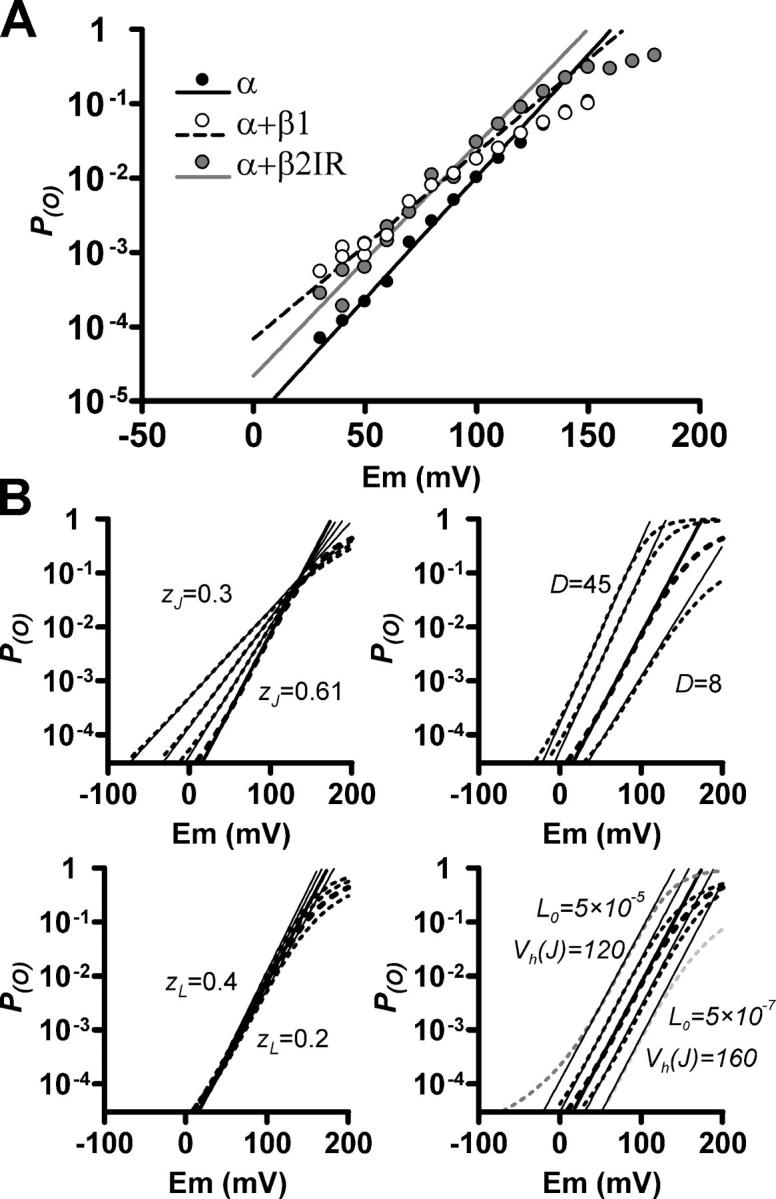
The maximum slope of the ln(P (O))/V relationship is highly affected by the z J parameter. (A) Semilogarithmic P (O)/V plots for α, α+β1, and α+β2IR channels. This is the same data as in Fig. 5 D, showing the P (O) > 10−5 range for a better appreciation of the maximum slope. Duplicate points correspond to data obtained by two different methods (unitary events quantification and macroscopic recordings). Lines represent the fit of the maximum slope found in the 0–100-mV range. (B) P (O)/V curves (dotted lines) simulated with Eq. 11 are plotted in the P (O) > 3 × 10⁻⁵ range. In each plot, the thicker dotted line is the same, corresponding to the following parameters: V h(J) = 140 mV, z J = 0.61, L 0 = 4.7 × 10⁻⁶, z L = 0.28, and D = 14.4. Thinner dotted lines were constructed varying z J (top left), D (top right), z L (bottom left), L 0 (bottom right, gray), or V h(J) (bottom right, black) in the indicated ranges. Continuous straight lines represent the maximum d(lnP (O))/dV value of each simulated curve.
The β Subunits and the Voltage Dependence of the Macroscopic Kinetics
Voltage sensor–associated and voltage sensor–independent processes can also be dissociated by analyzing the voltage dependence of the macroscopic kinetics of BK channel. To avoid contaminations arising from calcium-dependent processes, we studied the effect of the β subunits on the macroscopic kinetics of the BK channel in the virtual absence of calcium (10 nM or lower).
Fig. 7 A shows representative current traces for channel deactivation at −60 mV after a 200-mV depolarizing pulse. Both β subunits slow down the deactivation process of the channel, and the time course of the current induced by α+β1 channels is slower than that promoted by α+β2IR channels. Current traces are well fitted by a single exponential time course, and Fig. 7 B shows the deactivation time constants (τdeact) obtained in a wide range of voltages. In the voltage range from −220 to 0 mV, the deactivation time (τdeact) constant for α+β1 channels is higher (slower) than that for α+β2IR. At ∼0 mV, this tendency is inverted. Moreover, the semilogarithmic τdeact/V plots for α and α+ β2IR clearly show two slopes, while the α+β1 plot apparently shows only one slope.
Figure 7.
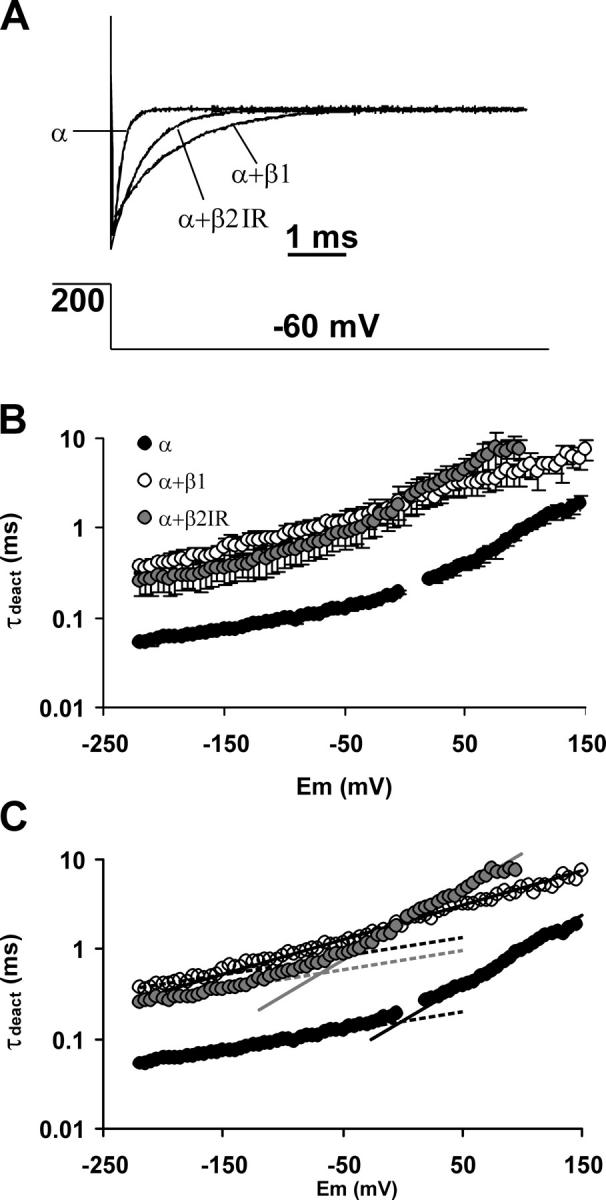
The β subunits and the voltage dependence of the deactivation kinetics in the absence of calcium. (A) Tail current traces evoked by a −60-mV pulse after opening the channels with a 200-mV activation pulse. Current magnitude of each trace was normalized by the mean current at the 200-mV steady state. Over the traces, the best fit to an exponential decay is shown. (B) Deactivation time constant (τdeact) plotted against voltage. Symbols represent mean ± SD. n = 3–4. For the α subunit, most of the SD bars fall within the symbols. (C) The range from −220 to −190 mV of each plot was fitted to Eq. 15 (dotted lines). The fit shown is with a shared value of z γ (0.13). The range from 20 to 100 mV (α), −50 to 100 mV (α+β1), and 0 to 75 mV (α+β2IR) was fit to the same equation (continuous lines). Obtained z values were 0.46, 0.23, and 0.47, respectively.
The observed behavior of the τdeact/V curve for the α subunit has already been reported and interpreted in terms of the allosteric model for voltage activation in the absence of calcium (Horrigan et al., 1999). Fig. 8 A shows the same allosteric model as in Fig. 1 B but with the kinetic rate constants in place of the equilibrium constants. As the voltage sensor movement is much faster than the opening and closure of the channel, with kinetic constants up to 100 times larger (Horrigan and Aldrich, 1999; Horrigan et al., 1999), the scheme can be abbreviated to the one in Fig. 8 B, which considers the voltage sensors in equilibrium. Upon a square voltage pulse, the time constant for current relaxation will be given by the γn and δn kinetic constants weighed by the relative probabilities of the On and Cn states, respectively. This is expressed by the equation
 |
(12) |
Figure 8.

Proposed kinetic scheme for BK channel in the absence of calcium. (A) Kinetic scheme proposed by Horrigan et al. (1999). α = α(0)exp(z α FV/RT), β = β(0)exp(−z β FV/RT), δn = δn(0)exp(z δ FV/RT), and γn = γn(0)exp(−z γ FV/RT). The correspondence with the scheme in Fig. 1 B is verified by the following equalities: J = α/β, L 0 = δ0/γ0, z J = z α + z β, z L = z δ + z γ, and D = (δn+1/γn+1)/(δn/γn) = f2. (B) Abbreviated kinetic scheme that considers the movement of the voltage sensors as in instantaneous equilibrium.
At low voltages, γn >> δn, and the expression can be approximated to
 |
(13) |
At very negative potentials, all voltage sensors will be in their resting state and therefore the only (or prevailing) open state will be O0. Then,
 |
(14) |
 |
(15) |
 |
(16) |
In other words, the τdeact/V plot will exhibit an exponential dependence to voltage (linear in a semilogarithmic plot) whenever the voltage sensors for the open channel are all in the resting state. Thus, the limiting voltage dependence of the macroscopic kinetics reveals a process unrelated to voltage sensor movements.
When the points from −220 to −190 of each plot are fitted to Eq. 15, a curve is defined (dotted lines in Fig. 7 C) that overlaps very well the points up to −35 mV for α, up to −160 mV for α+β1, and up to −120 mV for α+β2IR. These curves have the same value for z γ, 0.13 (P = 0.17 for different values). This indicates that the β1 and β2IR subunits do not affect the voltage dependence of the kinetic rate for channel closure (z γ). Since z L = z γ − z δ, it is expected that β subunits do not affect the voltage dependence of the kinetic rate for channel opening, z δ.
The fit of the τdeact/V plots to Eq. 15 also evidences that the α+β1 plot has two slopes. This second slope of the ln(τdeact)/V relationship obeys to a more complex relation than the first slope, involving all the γn (n > 0) kinetic constants (Eq. 13), and it is highly dependent on the voltage dependence of the voltage sensor activation. As expected, the z value for the second slope in α+β1 is much lower (0.23) compared with α (0.46) and α+β2IR (0.47).
Fig. 9 A shows representative current traces for BK channel activation at 200 mV in the absence and presence of the β1 and β2IR subunits. Both β subunits slow down channel activation, though the effect of the β2IR subunit is more pronounced. Like the deactivation time course, all traces are well fitted by a single exponential rise, and Fig. 9 B shows the activation time constant (τact) obtained at several activation voltages. The τact for channels formed by α+β1 and α+β2IR subunits are always higher than the α subunit alone, and the τact for α+β2IR currents are higher than for α+β1. In the voltage range presented here, the limiting voltage dependence is not reached and the only approximation that can be made from Eq. 12 is δn >> γ. Thus, the linear range in this plot obeys the expression
 |
(17) |
which involves voltage sensor equilibriums within closed states. The fit of this linear range to a simple exponential equation is shown in Fig. 9 C. As expected for a voltage sensor–related relationship, the z value for α+β1 (0.11) is lower than for α (0.19) and α+β2IR (0.24).
It is noteworthy that all three τact/V plots have more or less the same shape and a maximum around +140 mV. As mentioned before, this strongly suggests that the β subunits do not affect the half-activation voltage of the voltage sensors (see Horrigan et al., 1999).
In summary, the study of the voltage dependence of the macroscopic channel kinetics is consistent with our previous conclusions: (a) only the β1 subunit affects the voltage sensor–associated voltage dependence of BK channel, presumably decreasing the voltage dependence of the voltage sensor activation, (b) none of the studied β subunit affects the voltage dependence for the C–O transition, and (c) both β subunits enhance the allosteric coupling between voltage sensor activation and channel opening (allosteric factor D).
The β Subunits and the 70-state Allosteric Activation Model
We have established how the voltage sensitivity of the BK channel is affected by the β1 and β2IR subunits by looking at the channel behavior in the absence of calcium. Our next step is to evaluate the impact of these calcium-independent changes on the apparent calcium sensitivity of the channel, i.e., the behavior of the channel when the calcium concentration is increased. To do so, we fitted the P (O)/V relationships in the whole 5 nM–150 μM range to Eq. 1. P (O)/V curves for α, α+β1, and α+β2IR channels and at different calcium concentrations were averaged in a way that preserved the average V 0.5 and shape of the individual data obtained (see materials and methods). It is important to note that we and others (Horrigan and Aldrich, 2002) have noticed that a simple least-squares fit of the data to Eq. 1 can yield parameters far from those obtained by direct measurements. Therefore, before attempting such a fit, it is important to collect as much data as possible about realistic parameter values and introduce them as restrains in the fitting procedure. Also, we will refrain from drawing conclusions about the absolute values obtained with this procedure and will focus on the qualitative comparison between the different sets of parameters.
First, we obtained a satisfactory fit of the P (O)/V curves for α channels. Based on the maximum of the τact/V plots, as well as on previous data by others (Horrigan et al., 1999; Horrigan and Aldrich, 2002), we restricted V h(J) to be between 140 and 160 mV. After the results of the fit to the voltage-dependent activation in the absence of calcium (Table II), we applied the restrictions 0.5 < z J < 0.6, 0.25 < z L < 0.35, and 10−6 < L 0 < 10−5. K d, C, D, and E were only restricted to be higher than 0. The best fit obtained under these conditions is shown on Fig. 10 A, together with the best-fit parameters. The parameters obtained are in a reasonable agreement with those obtained in the absence of calcium (Table II) and with previous fits (Horrigan and Aldrich, 2002). The predicted V 0.5 and z values are plotted together with the experimental values in Fig. 10 (C and D) (continuous line and filled triangles, respectively), showing that these parameters reproduce very well the voltage- and calcium-dependent steady-state activation of the BK channel.
Figure 10.

A change in z J can account for the increase of the apparent calcium sensitivity in the presence of the β1 subunit. (A) Averaged experimental P (O)/V curves (symbols) and predictions of the best fit to Eq. 1 (lines) for α channels. Within the plot, the parameters of the best fit are shown. See the text for the restrictions applied. (B) Averaged experimental P (O)/V curves (symbols) and predictions of the best fit to Eq. 1 (lines) for α+β1 channels. In the left plot, the fit was done with the same parameters obtained in A (best fit parameters for α) and varying only z J. In the right plot, L 0 was fixed to 3 × 10⁻⁷ and z J, C, and D were varied. (C and D) Families of predicted P (O)/V curves were fitted to a Boltzmann distribution (Eq. 2) and the obtained V 0.5 (C) and z (D) values are plotted against calcium concentration (lines). Symbols represent the experimental values (these are the same values plotted in Fig. 2, C and D).
Our previous analysis demonstrated a significant reduction of the z J parameter in the presence of the β1 subunit. Therefore, we assessed the importance of this reduction in the apparent calcium sensitivity of the BK channel. Fig. 10 B, left, shows the result of fitting the α+β1 P (O)/V curves to Eq. 1 with all the parameters fixed at the same value as in the α fit, with the exception of z J, which was allowed to vary freely between 0.25 and 0.6. Surprisingly, a reduction of z J from 0.5 to 0.3 is enough to induce both the shift to the left of the G/V curves along the voltage axis as well as the reduction of their voltage dependence. This is best appreciated in Fig. 10 (C and D), where the fit (gray lines) accounts for the experimental V 0.5/[Ca2+] and z/[Ca2+] relationships (open triangles). A better fit is obtained when L 0 is set to 3 × 10⁻⁷ (to be in agreement with the results in Table II) and the allosteric factors C and D are left free to vary (Fig. 10 B, right). As in the fit to the model in absence of calcium (Table II), a higher D value is obtained compared with the fit parameters obtained for α channels. The z J value is still 0.3 and the allosteric factor C does not change, even though many iterations with different initial values were performed.
From the analysis of the data in the absence of calcium, we concluded that the β1 subunit reduces the voltage dependence of the activation of the voltage sensors. The fit to the allosteric model for the voltage- and calcium-dependent activation shows that this reduction can account for most of the characteristic increase of the apparent calcium sensitivity that the β1 subunit induces on the channel. The model predicts that an effect completely unrelated to the calcium-dependent activation parameters is almost sufficient to affect the apparent calcium sensitivity.
The fit of the P (O)/V curves for α+β2IR channels to Eq. 1 was first attempted with the following constraints: 0.25 < z J < 0.6; 0.25 < z L < 0.4; V h(J) =140; 10−8 < L 0 < 10−6 and K d, C, D, and E > 0. These are similar to the constraints applied to the fit for α except for a different range for L 0 (see Table II) and a wider range for z J. Fig. 11 A, left, plots the predictions of the best fit (lines) together with the experimental averaged P (O)/V curves (symbols) and the list of the best-fit parameters (fit 1). This fit predicts a z J value similar to that of α+β1 and much lower than for α, suggesting that the β2IR subunit also reduces the voltage dependence for voltage sensor activation. This result is incompatible with the maximum slope measurements (Fig. 6) and its deviation from the experimental data is clearly reflected in the failure of fit 1 to reproduce properly the z/[Ca2+] relationship (Fig. 11 C, continuous line). We ultimately restricted conditions so as to match best our previous experimental results. Therefore, we applied the following restrictions: from the fit of the P (O)/V curve in the absence of calcium we fixed V h(J) = 140 mV, 10−7 < L 0 < 10−6, z L = 0.3, and D = 29. From the same result, z J was restricted to be only slightly lower than the value for α, therefore the restriction was 0.45 < z J < 0.6. Finally, K d, C, and E > 0. One of the best fits obtained in this way is shown in Fig. 11 A, right (fit 2). Though fit 2 does not accurately characterize the P (O)/V relationships at all calcium concentrations, it does predict a higher voltage dependence (higher z values) than α+β1 channels (Fig. 11 C, dotted line). This is the key difference between β1 and β2IR subunits and should not be disregarded. Moreover, in the absence of calcium, the parameters from fit 2 predict a maximum dln(P (O))/dV value similar to that of the α fit and higher than the α+β1 fits (not depicted). Unlike the β1 subunit, this fit predicts the increase of the allosteric coupling factors for both calcium- and voltage-dependent activation (C and D, respectively). Remarkably, fit 2 also predicts an increase of the allosteric factor that relates the activation of voltage sensors with calcium binding (E). The above analysis suggests that the β2IR subunit enhances the calcium sensitivity of the BK channel by a different mechanism than the β1 subunit, involving changes in the allosteric coupling factors.
Figure 11.

Fit of the P (O)/V curves for α+β2IR to Eq. 1. (A) Averaged experimental P (O)/V curves (symbols) and predictions of the best fit to Eq. 1 (lines) for α channels. Fit 1 was performed using the following restrictions: 140 < V h(J) < 160, 0.25 < z L < 0.4, 0.25 < z J < 0.6. Fit 2 was performed using the following restrictions: 140 < V h(J) < 160, z L = 0.3, 0.45 < z J < 0.6, E > 0. In each case, the best-fit parameters obtained are listed to the right of the plot. (B and C) Families of predicted P (O)/V curves were fitted to a Boltzmann distribution (Eq. 2) and the obtained V 0.5 (B) and z (C) values are plotted against calcium concentration (lines). Symbols represent the experimental values for α+β2IR (these are the same values plotted in Fig. 2, C and D).
DISCUSSION
In this study we have addressed in detail the effects that the β2IR subunit has on the calcium and voltage dependence of the BK channel. By comparing the effects of the β1 and β2IR subunits, we draw three principal conclusions: (1) The reduction of the voltage dependence of the BK channel observed in the presence of the β1 subunit is strictly related to a reduction of the voltage dependence of the voltage sensor activation process (z J); (2) In the allosteric model for voltage- and calcium-dependent activation, this reduction of z J produces an increase of the apparent calcium sensitivity and is able to account for all the effects of the β1 subunit on the steady-state properties of BK channel, and (3) The β2IR subunit enhances the calcium sensitivity of the BK channel by a different mechanism than the β1 subunit, very likely to involve severe changes to the allosteric coupling factors.
Though previous studies showed a reduction of the BK channel voltage dependence in the presence of the β1 subunit (Cox and Aldrich, 2000), we probed further by determining whether this effect was related to a modification in the voltage sensor activation mechanism. The reduction of the maximum dln(P (O))/dV relationship or maximum slope in the presence of the β1 subunit is a clear indication that the voltage dependence of the voltage sensor activation is the parameter affected by this subunit. Surprisingly, when introduced into the allosteric activation model, this reduction in the voltage dependence provokes an increase of the apparent calcium sensitivity, almost identical to the effect of the β subunit on the BK channel. The similarity to the steady-state effects of the β1 subunit becomes more striking when ΔG values as a function of calcium concentration are predicted from the model. Fig. 12 A shows ΔG values corresponding to the fits in Fig. 10 plotted against calcium concentration, together with the corresponding fits to Eq. 6. Just like with the fit of the experimental data (Table I), reducing the z J value is enough to provoke a slight decrease on the EC 50 for the effect of calcium on channel energetic. While in the experimental data (Table I) this shift was from 3 to 1.5 μM (not significant because of the data dispersion), in the model, a reduction of z J produces an almost identical shift from 3.4 to 1.9 μM. This also shows that the EC 50 value for the ΔG/[Ca2+] relationship is related to more than just the K d and C parameters.
Figure 12.

Effects of a reduction of z J in the allosteric activation model. (A) A reduction of z J in the allosteric model affects the ΔG/[Ca2+] relationships in the same way as the β1 subunit. Symbols represent ΔG values predicted by the allosteric activation model. For each calcium concentration, V 0.5 and z values were calculated by fitting predicted P (O)/V curves to Eq. 2 and ΔG was calculated as −zFV 0.5. The parameters used are the same as in Fig. 10. Lines represent a fit of the data to Eq. 6. For α, the best-fit logEC 50 value is 0.54 and EC 50 = 3.4 μM. For α+β1 (z J = 0.3), logEC 50 = 0.28 and EC 50 = 1.9 μM. For α+β1 (var. z J, L 0, C, and D), logEC 50 = 0.30 and EC 50 = 2.0 μM. (B) A reduction of z J implies a higher J for any V < V h(J). J values were calculated as exp[z JF(V − V h(J))/RT] with V h(J) = 140 mV and the indicated z J values. Dotted lines indicate that J = 1 when V = V h(J).
How we can explain that a change completely unrelated to the effect of calcium produces such a change in the apparent calcium sensitivity? The z J parameter defines how J changes with voltage, as J = exp[z JF(V − V h(J))/RT]. Fig. 12 B shows an important effect of changing z J: at any voltage lower than V h(J), J will be higher when z J is lower. As the P (O) of the BK channel increases with J, the effect of the β1 subunit would be of increasing the P (O) at any voltage <140 mV. This explains that when the V 0.5 of the channel is >140 mV (at [Ca2+] < 200 nM) the β1 subunit appears with a double effect: it increases the P (O) at V < 140 mV and decreases it at V > 140 mV, with the consequent increase in V 0.5. On the contrary, when the V 0.5 for the α subunit is <140 mV ([Ca2+] > 200 nM), the β1 subunit appears only to increase the P (O) at any voltage with the consequent decrease of V 0.5.
Qian et al. (2002), showed that the β1 subunit can still enhance the calcium sensitivity of BK channels with a disrupted Ca2+ bowl, but not when the entire “tail” domain is replaced with the tail from the highly related, pH-dependent, Slo3 channel. Our interpretation of the data offers an explanation for those findings. In the case of the disrupted Ca2+ bowl, the channel is partially calcium dependent, and thus the β1 subunit still enhances the apparent calcium sensitivity by activating it whenever the V 0.5 is <∼140 mV. The Slo1 core/Slo3 tail construct is completely calcium independent and is only activated by voltage (Schreiber et al., 1999). Therefore, the only effect of the β1 subunit that can be detected on this channel is a reduction of the voltage dependence and the consequent increase of V 0.5 just as it does for the wild-type channel in the absence of calcium.
Previous works (Cox and Aldrich, 2000; Nimigean and Magleby, 2000) reported an increase of the intrinsic equilibrium constant for channel opening, represented in the allosteric model by the parameter L 0. This was proposed to explain the increase of the open probability that the β1 subunit produces between 0 and 100 mV in the absence of calcium. The appropriate condition to measure L 0 is, however, in the absence of calcium and at lower voltages so that the voltage sensors are in the resting position (see Eq. 9). Under these conditions, we found that β1 actually decreases the intrinsic open–close equilibrium constant, L 0. Fig. 5 clearly shows that the β subunits reduce, rather than increase, the open probability of the BK channel at 0 Ca2+ and voltages lower than −50 mV. We conclude that the β1 subunit increases the P (O) in the 0–100 mV range because the reduced z J increases the equilibrium constant for voltage sensor activation. When the calcium and voltage dependences are studied in terms of the macroscopic P (O)/V curves (Cox and Aldrich, 2000; see Fig. 10 and 11), a change in L 0 is unnecessary to reproduce the effects of the β1 subunit. This is because when all other parameters are kept constant, any decrease of L 0 will be compensated by an increase of the allosteric factor D.
Both β1 and β2IR subunits have a dramatic effect on channel kinetics, slowing down the macroscopic current relaxation as well as increasing the mean open and closed times of single channel activity (Nimigean and Magleby, 2000; and current traces in Fig. 4, C and E). This implies that both the γ and δ kinetic constants are decreased due to the presence of the β subunits. As L 0 = δ0(0)/γ0(0), it follows that the effect on these kinetic rate constants must be asymmetric otherwise L 0 would not change. δ0(0), the kinetic rate constant for the opening of the channel, has to be the more affected (decreased) by these regulatory subunits.
Unlike the β1 subunit, we were unable to identify a simple parameter change that would account for the effects of the β2IR subunit on the voltage and calcium sensitivity of the BK channel. The best fit to the data using the allosteric model indicates an increase in the allosteric coupling factor (C, D, and E), together with slight decreases of the calcium binding affinity and the voltage dependence of the voltage sensor activation. What is the molecular nature of an increase of the allosteric coupling factors? It has been proposed that the intracellular domains of each BK α subunit contributes two RCK (regulatory of K+ conductance) domains and that these eight RCK domains form a gating ring similar to the gating ring of MthK channels (Jiang et al., 2001, 2002). From the structure of the MthK channel, it is thought that this gating ring is in charge of extracting free energy from calcium binding, thus providing a molecular basis for the functional coupling between calcium binding and pore gate opening. Recently, the linker between the sixth (S6) transmembrane domain and the first RCK domain of the BK channel has also been shown to play a role in this molecular coupling, acting as a passive spring (Niu et al., 2004). We expect that a change in the allosteric factor C would be related to some interaction of any (or both) of these domains with the β subunits, stabilizing an “active” conformation that in turn stabilizes the open state of the pore. In the case of the molecular coupling between voltage sensor activation and channel opening, the S4–S5 linker as well as the COOH-terminal half of the S6 segment have been postulated to play this role in other voltage-gated channels (Chen et al., 2001; Lu et al., 2002; Tristani-Firouzi et al., 2002). Thus, a change of the allosteric factor D would be related to some interaction with those intracellular domains.
Acknowledgments
We thank Dr. Ligia Toro for providing the cDNAs used in this work and Mr. Timothy Warren for his helpful revision of the manuscript.
This work was supported by grants from the Fondo Nacional de Investigación Científica y Tecnológica (Fondecyt 103-0830) (R. Latorre) and the Human Frontiers in Science Program (R. Latorre). The Centro de Estudios Científicos is a Millennium Science Institute and is funded in part by a grant from Fundación Andes.
Lawrence G. Palmer served as editor.
Abbreviation used in this paper: RCK, regulatory of K+ conductance.
References
- Almers, W. 1978. Gating currents and charge movements in excitable membranes. Rev. Physiol. Biochem. Pharmacol. 82:96–190. [DOI] [PubMed] [Google Scholar]
- Alvarez, O., C. Gonzalez, and R. Latorre. 2002. Counting channels: a tutorial guide on ion channel fluctuation analysis. Adv. Physiol. Educ. 26:327–341. [DOI] [PubMed] [Google Scholar]
- Behrens, R., A. Nolting, F. Reimann, M. Schwarz, R. Waldschutz, and O. Pongs. 2000. hKCNMB3 and hKCNMB4, cloning and characterization of two members of the large-conductance calcium-activated potassium channel β subunit family. FEBS Lett. 474:99–106. [DOI] [PubMed] [Google Scholar]
- Brenner, R., T.J. Jegla, A. Wickenden, Y. Liu, and R.W. Aldrich. 2000. a. Cloning and functional characterization of novel large conductance calcium-activated potassium channel β subunits, hKCNMB3 and hKCNMB4. J. Biol. Chem. 275:6453–6461. [DOI] [PubMed] [Google Scholar]
- Brenner, R., G.J. Perez, A.D. Bonev, D.M. Eckman, J.C. Kosek, S.W. Wiler, A.J. Patterson, M.T. Nelson, and R.W. Aldrich. 2000. b. Vasoregulation by the β1 subunit of the calcium-activated potassium channel. Nature. 407:870–876. [DOI] [PubMed] [Google Scholar]
- Chen, J., J.S. Mitcheson, M. Tristani-Firouzi, M. Lin, and M.C. Sanguinetti. 2001. The S4-S5 linker couples voltage sensing and activation of pacemaker channels. Proc. Natl. Acad. Sci. USA. 98:11277–11282. [DOI] [PMC free article] [PubMed] [Google Scholar]
- Cox, D.H., and R.W. Aldrich. 2000. Role of the β1 subunit in large-conductance Ca2+-activated K+ channel gating energetics. Mechanisms of enhanced Ca2+ sensitivity. J. Gen. Physiol. 116:411–432. [DOI] [PMC free article] [PubMed] [Google Scholar]
- Cui, J., and R.W. Aldrich. 2000. Allosteric linkage between voltage and Ca2+-dependent activation of BK-type mslo1 K+ channels. Biochemistry. 39:15612–15619. [DOI] [PubMed] [Google Scholar]
- Cui, J., D.H. Cox, and R.W. Aldrich. 1997. Intrinsic voltage dependence and Ca2+ regulation of mslo large conductance Ca-activated K+ channels. J. Gen. Physiol. 109:647–673. [DOI] [PMC free article] [PubMed] [Google Scholar]
- Diaz, L., P. Meera, J. Amigo, E. Stefani, O. Alvarez, L. Toro, and R. Latorre. 1998. Role of the S4 segment in a voltage-dependent calcium-sensitive potassium (hSlo) channel. J. Biol. Chem. 273:32430–32436. [DOI] [PubMed] [Google Scholar]
- Dworetzky, S.I., C.G. Boissard, J.T. Lum-Ragan, M.C. McKay, D.J. Post-Munson, J.T. Trojnacki, C.P. Chang, and V.K. Gribkoff. 1996. Phenotypic alteration of a human BK (hSlo) channel by hSloβ subunit coexpression: changes in blocker sensitivity, activation/relaxation and inactivation kinetics, and protein kinase A modulation. J. Neurosci. 16:4543–4550. [DOI] [PMC free article] [PubMed] [Google Scholar]
- Ha, T.S., M.S. Heo, and C.S. Park. 2004. Functional effects of auxiliary β4-subunit on rat large-conductance Ca2+-activated K+ channel. Biophys. J. 86:2871–2882. [DOI] [PMC free article] [PubMed] [Google Scholar]
- Hanner, M., W.A. Schmalhofer, P. Munujos, H.G. Knaus, G.J. Kaczorowski, and M.L. Garcia. 1997. The β subunit of the high-conductance calcium-activated potassium channel contributes to the high-affinity receptor for charybdotoxin. Proc. Natl. Acad. Sci. USA. 94:2853–2858. [DOI] [PMC free article] [PubMed] [Google Scholar]
- Horrigan, F.T., and R.W. Aldrich. 1999. Allosteric voltage gating of potassium channels II. mSlo channel gating charge movement in the absence of Ca2+. J. Gen. Physiol. 114:305–336. [DOI] [PMC free article] [PubMed] [Google Scholar]
- Horrigan, F.T., and R.W. Aldrich. 2002. Coupling between voltage sensor activation, Ca2+ binding, and channel opening in large conductance (BK) potassium channels. J. Gen. Physiol. 120:267–305. [DOI] [PMC free article] [PubMed] [Google Scholar]
- Horrigan, F.T., J. Cui, and R.W. Aldrich. 1999. Allosteric voltage gating of potassium channels I. mSlo ionic currents in the absence of Ca2+. J. Gen. Physiol. 114:277–304. [DOI] [PMC free article] [PubMed] [Google Scholar]
- Jiang, Y., A. Lee, J. Chen, M. Cadene, B.T. Chait, and R. MacKinnon. 2002. Crystal structure and mechanism of a calcium-gated potassium channel. Nature. 417:515–522. [DOI] [PubMed] [Google Scholar]
- Jiang, Y., A. Pico, M. Cadene, B.T. Chait, and R. MacKinnon. 2001. Structure of the RCK domain from the E. coli K+ channel and demonstration of its presence in the human BK channel. Neuron. 29:593–601. [DOI] [PubMed] [Google Scholar]
- Knaus, H.G., K. Folander, M. Garcia-Calvo, M.L. Garcia, G.J. Kaczorowski, M. Smith, and R. Swanson. 1994. Primary sequence and immunological characterization of β-subunit of high conductance Ca2+-activated K+ channel from smooth muscle. J. Biol. Chem. 269:17274–17278. [PubMed] [Google Scholar]
- Lu, Z., A.M. Klem, and Y. Ramu. 2002. Coupling between voltage sensors and activation gate in voltage-gated K+ channels. J. Gen. Physiol. 120:663–676. [DOI] [PMC free article] [PubMed] [Google Scholar]
- Magleby, K.L. 2003. Gating mechanism of BK (Slo1) channels: so near, yet so far. J. Gen. Physiol. 121:81–96. [DOI] [PMC free article] [PubMed] [Google Scholar]
- McManus, O.B., L.M. Helms, L. Pallanck, B. Ganetzky, R. Swanson, and R.J. Leonard. 1995. Functional role of the β subunit of high conductance calcium-activated potassium channels. Neuron. 14:645–650. [DOI] [PubMed] [Google Scholar]
- Meera, P., M. Wallner, Z. Jiang, and L. Toro. 1996. A calcium switch for the functional coupling between α(hslo) and β subunits (Kv,Caβ) of maxi K channels. FEBS Lett. 385:127–128. [DOI] [PubMed] [Google Scholar]
- Meera, P., M. Wallner, and L. Toro. 2000. A neuronal β subunit (KCNMB4) makes the large conductance, voltage- and Ca2+-activated K+ channel resistant to charybdotoxin and iberiotoxin. Proc. Natl. Acad. Sci. USA. 97:5562–5567. [DOI] [PMC free article] [PubMed] [Google Scholar]
- Neely, A., and C.J. Lingle. 1992. Two components of calcium-activated potassium current in rat adrenal chromaffin cells. J. Physiol. 453:97–131. [DOI] [PMC free article] [PubMed] [Google Scholar]
- Nelson, M.T., and J.M. Quayle. 1995. Physiological roles and properties of potassium channels in arterial smooth muscle. Am. J. Physiol. 268:C799–C822. [DOI] [PubMed] [Google Scholar]
- Nimigean, C.M., and K.L. Magleby. 2000. Functional coupling of the β1 subunit to the large conductance Ca2+-activated K+ channel in the absence of Ca2+. Increased Ca2+ sensitivity from a Ca2+-independent mechanism. J. Gen. Physiol. 115:719–736. [DOI] [PMC free article] [PubMed] [Google Scholar]
- Niu, X., X. Qian, and K.L. Magleby. 2004. Linker-gating ring complex as passive spring and Ca2+-dependent machine for a voltage- and Ca2+-activated potassium channel. Neuron. 42:745–756. [DOI] [PubMed] [Google Scholar]
- Orio, P., P. Rojas, G. Ferreira, and R. Latorre. 2002. New disguises for an old channel: MaxiK channel β-subunits. News Physiol. Sci. 17:156–161. [DOI] [PubMed] [Google Scholar]
- Qian, X., and K.L. Magleby. 2003. β1 subunits facilitate gating of BK channels by acting through the Ca2+, but not the Mg2+, activating mechanisms. Proc. Natl. Acad. Sci. USA. 100:10061–10066. [DOI] [PMC free article] [PubMed] [Google Scholar]
- Qian, X., C.M. Nimigean, X. Niu, B.L. Moss, and K.L. Magleby. 2002. Slo1 tail domains, but not the Ca2+ bowl, are required for the β1 subunit to increase the apparent Ca2+ sensitivity of BK channels. J. Gen. Physiol. 120:829–843. [DOI] [PMC free article] [PubMed] [Google Scholar]
- Rothberg, B.S., and K.L. Magleby. 1999. Gating kinetics of single large-conductance Ca2+-activated K+ channels in high Ca2+ suggest a two-tiered allosteric gating mechanism. J. Gen. Physiol. 114:93–124. [DOI] [PMC free article] [PubMed] [Google Scholar]
- Rothberg, B.S., and K.L. Magleby. 2000. Voltage and Ca2+ activation of single large-conductance Ca2+-activated K+ channels described by a two-tiered allosteric gating mechanism. J. Gen. Physiol. 116:75–99. [DOI] [PMC free article] [PubMed] [Google Scholar]
- Sah, P., and P. Davies. 2000. Calcium-activated potassium currents in mammalian neurons. Clin. Exp. Pharmacol. Physiol. 27:657–663. [DOI] [PubMed] [Google Scholar]
- Schreiber, M., A. Yuan, and L. Salkoff. 1999. Transplantable sites confer calcium sensitivity to BK channels. Nat. Neurosci. 2:416–421. [DOI] [PubMed] [Google Scholar]
- Shi, J., and J. Cui. 2001. Intracellular Mg2+ enhances the function of BK-type Ca2+-activated K+ channels. J. Gen. Physiol. 118:589–606. [DOI] [PMC free article] [PubMed] [Google Scholar]
- Sigg, D., and F. Bezanilla. 1997. Total charge movement per channel. The relation between gating charge displacement and the voltage sensitivity of activation. J. Gen. Physiol. 109:27–39. [DOI] [PMC free article] [PubMed] [Google Scholar]
- Sigworth, F.J. 1980. The variance of sodium current fluctuations at the node of Ranvier. J. Physiol. 307:97–129. [DOI] [PMC free article] [PubMed] [Google Scholar]
- Solaro, C.R., M. Prakriya, J.P. Ding, and C.J. Lingle. 1995. Inactivating and noninactivating Ca2+- and voltage-dependent K+ current in rat adrenal chromaffin cells. J. Neurosci. 15:6110–6123. [DOI] [PMC free article] [PubMed] [Google Scholar]
- Stefani, E., M. Ottolia, F. Noceti, R. Olcese, M. Wallner, R. Latorre, and L. Toro. 1997. Voltage-controlled gating in a large conductance Ca2+-sensitive K+ channel (hslo). Proc. Natl. Acad. Sci. USA. 94:5427–5431. [DOI] [PMC free article] [PubMed] [Google Scholar]
- Stühmer, W., and A.B. Parekh. 1995. Electrophysiological recordings from Xenopus oocytes. single channel recording. B. Sakmann and E. Neher, editors. Plenum Press, New York. 341–356.
- Talukder, G., and R.W. Aldrich. 2000. Complex voltage-dependent behavior of single unliganded calcium-sensitive potassium channels. Biophys. J. 78:761–772. [DOI] [PMC free article] [PubMed] [Google Scholar]
- Toro, L., M. Wallner, P. Meera, and Y. Tanaka. 1998. Maxi-KCa, a unique member of the voltage-gated K channel superfamily. News Physiol. Sci. 13:112–117. [DOI] [PubMed] [Google Scholar]
- Tristani-Firouzi, M., J. Chen, and M.C. Sanguinetti. 2002. Interactions between S4-S5 linker and S6 transmembrane domain modulate gating of HERG K+ channels. J. Biol. Chem. 277:18994–19000. [DOI] [PubMed] [Google Scholar]
- Uebele, V.N., A. Lagrutta, T. Wade, D.J. Figueroa, Y. Liu, E. McKenna, C.P. Austin, P.B. Bennett, and R. Swanson. 2000. Cloning and functional expression of two families of β-subunits of the large conductance calcium-activated K+ channel. J. Biol. Chem. 275:23211–23218. [DOI] [PubMed] [Google Scholar]
- Valverde, M.A., P. Rojas, J. Amigo, D. Cosmelli, P. Orio, M.I. Bahamonde, G.E. Mann, C. Vergara, and R. Latorre. 1999. Acute activation of Maxi-K channels (hSlo) by estradiol binding to the β subunit. Science. 285:1929–1931. [DOI] [PubMed] [Google Scholar]
- Wallner, M., P. Meera, and L. Toro. 1999. Molecular basis of fast inactivation in voltage and Ca2+-activated K+ channels: a transmembrane β-subunit homolog. Proc. Natl. Acad. Sci. USA. 96:4137–4142. [DOI] [PMC free article] [PubMed] [Google Scholar]
- Xia, X.M., J.P. Ding, and C.J. Lingle. 1999. Molecular basis for the inactivation of Ca2+- and voltage-dependent BK channels in adrenal chromaffin cells and rat insulinoma tumor cells. J. Neurosci. 19:5255–5264. [DOI] [PMC free article] [PubMed] [Google Scholar]
- Xia, X.M., J.P. Ding, X.H. Zeng, K.L. Duan, and C.J. Lingle. 2000. Rectification and rapid activation at low Ca2+ of Ca2+-activated, voltage-dependent BK currents: consequences of rapid inactivation by a novel β subunit. J. Neurosci. 20:4890–4903. [DOI] [PMC free article] [PubMed] [Google Scholar]
- Xia, X.M., X. Zeng, and C.J. Lingle. 2002. Multiple regulatory sites in large-conductance calcium-activated potassium channels. Nature. 418:880–884. [DOI] [PubMed] [Google Scholar]
- Zeng, X.H., J.P. Ding, X.M. Xia, and C.J. Lingle. 2001. Gating properties conferred on BK channels by the β3b auxiliary subunit in the absence of its NH2 and COOH termini. J. Gen. Physiol. 117:607–628. [DOI] [PMC free article] [PubMed] [Google Scholar]
- Zhang, X., C.R. Solaro, and C.J. Lingle. 2001. Allosteric regulation of BK channel gating by Ca2+ and Mg2+ through a nonselective, low affinity divalent cation site. J. Gen. Physiol. 118:607–636. [DOI] [PMC free article] [PubMed] [Google Scholar]