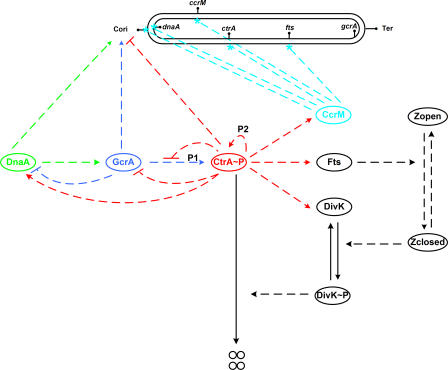
Figure 3. Wiring Diagram of the DNA Replication-Driven Model.
The double-stranded closed curve at the top represents DNA. Cori is the origin of DNA replication and Ter stands for the termination site. All proteins (ovals) are assumed to be produced and degraded at specific rates. Only the degradation of CtrA is shown on the diagram (four small circles indicate products of CtrA degradation), in order to indicate how this step is regulated by closure of the Z-ring (Zclosed) and subsequent phosphorylation of DivK. Dashed lines denote regulatory effects among the components. DNA methylation sites on genes are marked by cyan stars.

