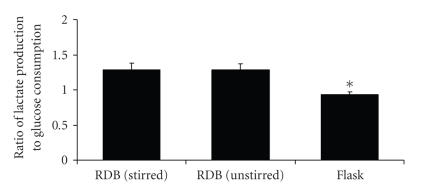
Figure 8.
Lactate production in bioreactor cultures. Graph of lactate production by EL-4 colonies after culture in rotating disc bioreactors with stirring (Re = 600) or without stirring, compared to values of static flask cultures. Bars represent the means of 3 experimental groups; error bars represent standard error of the mean; the asterisk pertains to .

