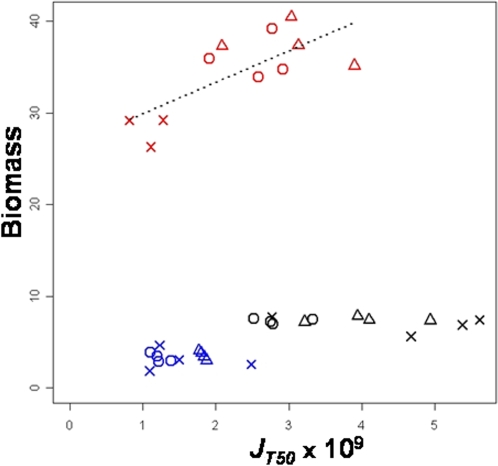
Figure 4. Relationship between biomass and glucose consumption rate.
Biomass is defined as the product of carrying capacity by cell size. Each point corresponds to the mean value of a strain in a culture condition. Blue, black and red colors correspond respectively to 0.25%, 1% and 15% glucose. Vinery strains are represented by circles, brewery ones by crosses and bakery ones by triangles.

