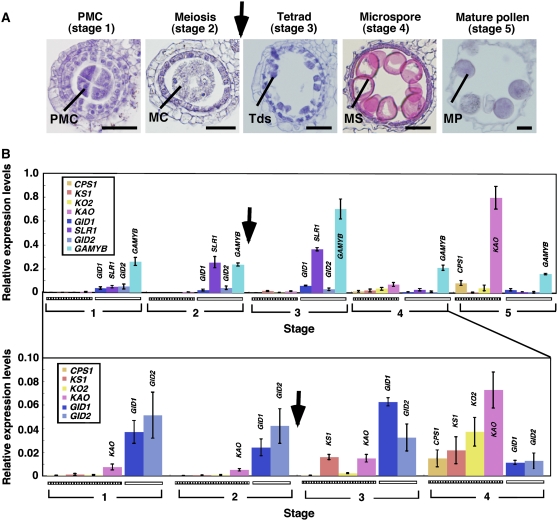
Figure 7.
Expression Pattern of GA Synthesis and GA-Signaling Genes in the Process of Anther Development.
(A) Anther development of wild-type rice at various stages. Each developmental stage was scored according to the length of the lemma: pollen mother cell stage (stage 1, lemma 2 mm), meiosis stage (stage 2, 2 to 3 mm), tetrad stage (stage 3, 3 to 5 mm), microspore stage (stage 4, 5 to 8 mm), and mature pollen stage (stage 5, ∼8 mm). Arrow indicates the timing of cytokinesis of meiosis. PMC, pollen mother cell; MC, meiocyte; Tds, tetrads; MS, microspore; MP, mature pollen. Bars = 25 μm.
(B) Quantitative RT-PCR analysis of GA biosynthesis and GA-signaling genes at various anther developmental stages. The numbers 1 to 5 correspond to the anther developmental stages. Relative mRNA level was determined by normalizing the PCR threshold cycle number of each gene with that of the Actin1 reference gene, and data were the average of three replicates. The top panel represents the relative expression levels of all genes tested at stages 1 to 5. The bottom panel shows the enlarged view of the expression levels of genes with lower expression at stages 1 to 4. The striped and open boxes represent the GA synthesis and GA-signaling genes, respectively. Arrows indicate the timing of cytokinesis of meiosis. Error bars represent se of three biological replicates.

