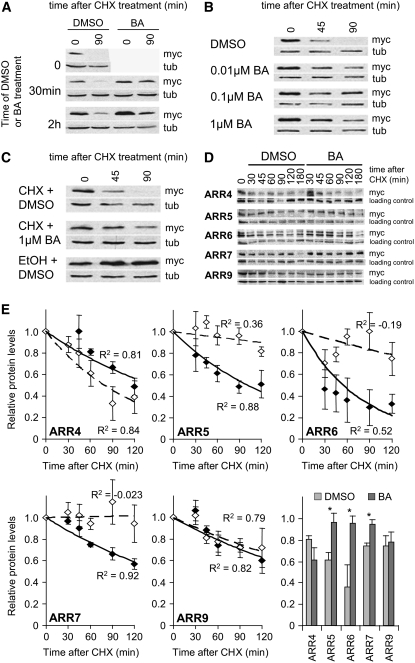
Figure 3.
A Subset of Type-A ARR Proteins Are Stabilized by Exogenous Cytokinin Application.
(A) to (D) myc-ARR5 protein is stabilized by exogenous cytokinin. myc-ARR5 protein was generated in 7-d-old light-grown seedlings in a DEX-inducible myc-ARR5 (DMA5) line by a 2-h 1 μM DEX treatment.
(A) Cytokinin stabilization of myc-ARR5 protein occurs within 30 min and is effective at 2 h. After DEX induction of myc-ARR5 protein production, 1 μM BA or 0.1% DMSO control was added for the times indicated at left before CHX treatment.
(B) Cytokinin stabilization of ARR5 is sensitive to low concentrations of BA. Seedlings were treated with the indicated concentrations of BA or DMSO control during DEX treatment, followed by CHX application.
(C) Cytokinin stabilization of myc-ARR5 does not require new protein synthesis. After DEX treatment, 200 μM CHX (or ethanol [EtOH] control) and 1 μM BA (or 0.1% DMSO control) were applied simultaneously and myc-ARR5 protein turnover was analyzed as in (A).
(D) A subset of type-A ARRs are stabilized by exogenous cytokinin application. Seven-day-old light-grown ARR4OX, ARR5OX, ARR6OX, ARR7OX, and ARR9OX seedlings were treated simultaneously with 200 μM CHX and 1 μM BA or 0.1% DMSO control. Three independent experiments were conducted with consistent results, and one representative blot is shown.
(E) Relative myc-ARR protein levels were normalized to loading control and to myc-ARR protein levels at time 0. The results from three independent experiments were averaged and shown with error bars indicating se. Note that the upper band for ARR6 was quantified. An exponential best-fit curve was fitted through the data points to estimate protein half-life. Correlation coefficient (R2) values are indicated as a measure of curve fit. Closed symbols and solid lines represent DMSO control. Open symbols and broken lines represent BA treatment. The bottom right panel shows relative protein levels at 60 min after CHX treatment. Asterisks indicate statistical differences between BA treatment and DMSO control within each transgenic line (Student's t test, P < 0.05).

