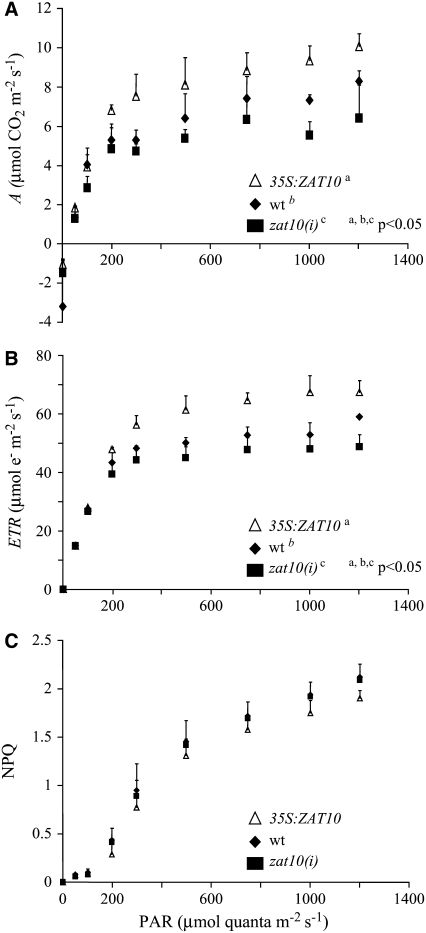
Figure 4.
Photosynthetic Rates and Nonphotochemical Quenching for the Wild Type, zat10(i), and 35S:ZAT10.
(A) Net CO2 fixation (A).
(B) Linear electron transport rate through PSII (ETR).
(C) Nonphotochemical quenching (NPQ).
Parameters were measured by gas exchange analysis over increasing light intensities (photosynthetically active radiance [PAR]). Each point is the mean ± se of three to five leaves from at least three different plants. P values from t tests of the means of values for 500 to 1200 μmol photons m−2 s−1 are shown.

