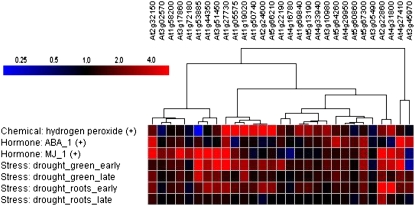
Figure 9.
Coregulated genes in HL, Distal, and 35S:ZAT10 Leaves.
Genes significantly upregulated in HL, distal, and 35S:ZAT10 arrays were hierarchically clustered using Pearson's correlation (Genevestigator v3.0) with gene expression changes in response to hormone and selected stress treatments. Red indicates upregulation and blue downregulation (see inset for scale).

