
Figure 2.
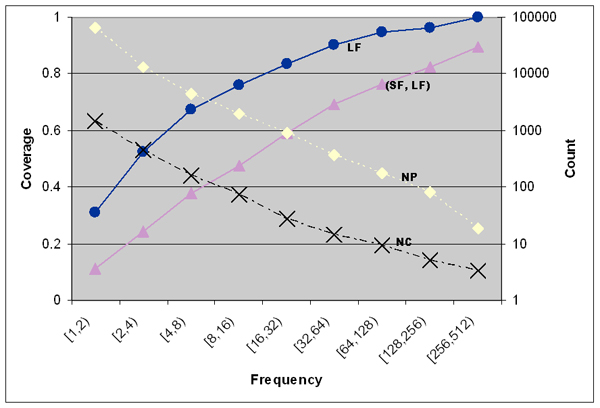
Results of the coverage study. X-axis is the frequency bin [2n, 2n+1) where n from 0 to 8, the first Y-axis (left side) is the coverage and the second Y-axis (right side) is the number of unique pairs. Four lines mean: Line NP – the total number of unique pairs for each bin. Line LF – the percentage of unique pairs (SF, LF) where LF can be mapped to the knowledge base. Line (SF, LF) – the percentage of pairs where the synonymous relationship between SF and LF can be inferred. Line NC – the percentage of pairs where LF cannot be mapped to knowledge bases.