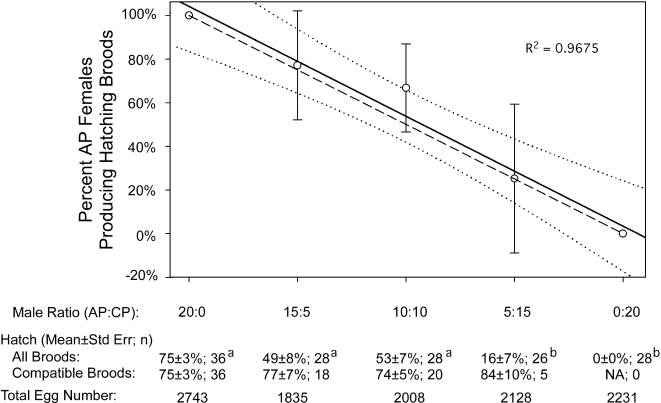
Figure 3. A. polynesiensis suppression strategy and CP male competitiveness.
Based upon the observed egg hatch rate, females are scored as either ‘compatible mating’ ( = eggs hatching) or ‘incompatible mating’ ( = eggs not hatching). The percent compatible females (compatible females/total females) is determined for each cage replicate (10 females/cage; 5 cage replicates/treatment). Circles and bars indicate the mean±standard deviation for each treatment (i.e., male ratio). The trend line (solid line) with 95% confidence intervals (dotted lines) are generated based upon the observed values. Predicted values (dashed line) are calculated assuming equal competitiveness of CP and AP males. Below the graph, egg hatch rates are based upon the combined oviposition of females within cages. Differing superscripted letters indicate significant differences (Two-tailed, Mann-Whitney, P<0.01, Bonferroni corrected). R2 value is shown for the trend line fitted to observations.

