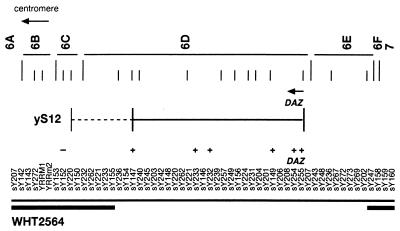
Figure 1.
STS map of the AZFc region, including the positions of the DAZ gene cluster and RBM (YRRM) genes adapted from Reijo et al. (3). At the top are 22 intervals defined by patient deletions and YAC endpoints. Below that are minimum and maximum possible extents of yS12 revealed by testing for the presence (+) or absence (−) of indicated STS markers. The broken bar indicates the minimal AZFc region as defined by the deletion in azoospermic patient WHT2564 (3). All STSs have been described (3, 41).

