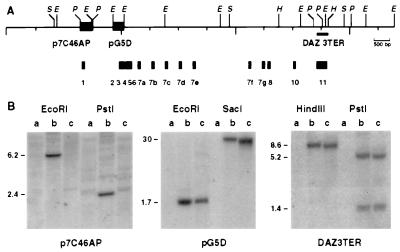
Figure 2.
(A) Restriction map of DAZ gene indicating the positions of probe fragments and DAZ exons 1–11. Scale in bp is shown. (B) Southern analysis of genomic DNA from wild-type mouse (a), human male (b), and TgS12 transgenic mouse (c) with probes derived from the DAZ genomic region. Probes (p7C46AP, pG5D, and DAZ3TER) used are indicated at the bottom.

