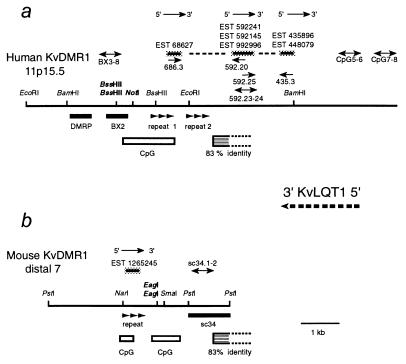
Figure 2.
The human and mouse KvDMR1 loci. (a) Physical map of the human locus showing restriction sites with respect to hybridization probes DMRP and BX2 (solid black boxes), the KvDMR1 CpG island, the position of two direct repeat structures, and several ESTs transcribed in the opposite (antisense) direction compared with KvLQT1. The dashed line connecting these ESTs indicates that amplification products joining these cDNA fragments could be obtained by RT-PCR by using EST-specific primers. The bidirectional arrows (primer names indicated above) correspond to positive RT-PCR assays used to “sample” the genomic DNA sequence for expressed sequences. (b) Physical map of the syntenic mouse locus (same symbols as in a). A region of homology (83% identity over 437 bp) between the mouse and human loci is indicated by the striped box (the open end indicates that the downstream extent of homology is unknown, as the mouse sequence is not complete).

